
Corn Futures Price Chart Review
Corn Futures: Listed below are 2 price charts, top one is old crop and the bottom one is new crop corn. Corn has been finding resistance at former support indicated by the horizontal blue lines on the charts. You will also notice the new crop corn chart did not go down and break the pre […]
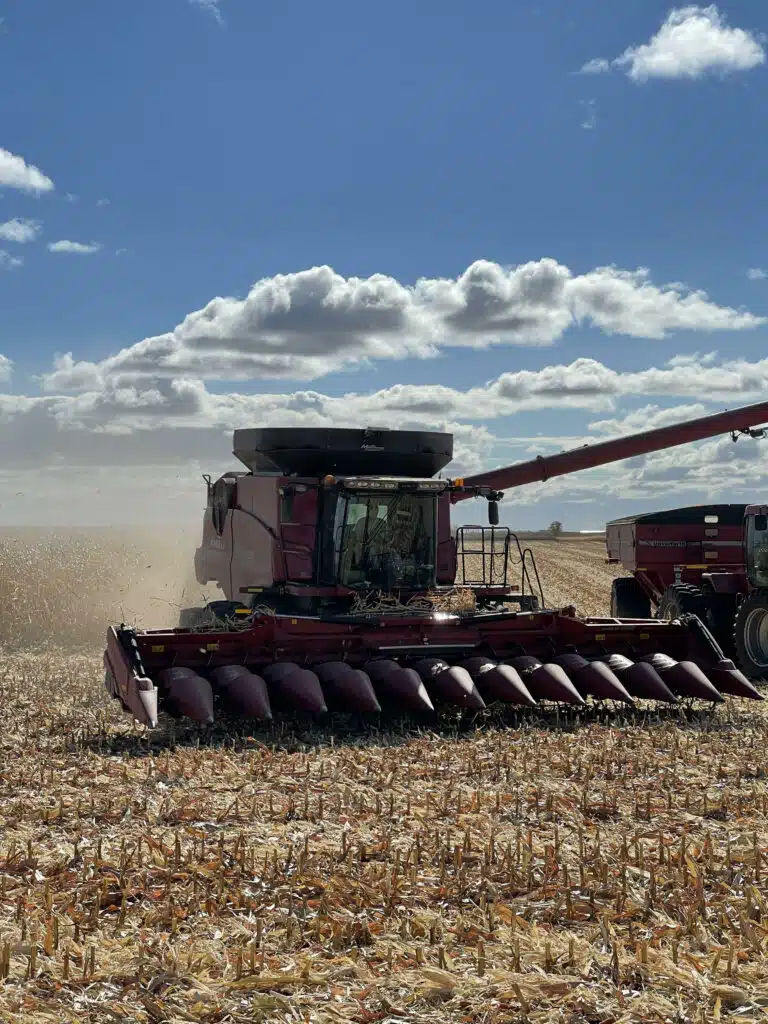
Crop Conditions

Corn🔹(G+E%) 61 -3% WoW Soybeans🔹(G+E%) 59 -3% WoW Spring Wheat🔹(G+E%) 60 -4% WoW Winter Wheat🔹(G+E%) 38 +2% WoW Crop conditions face concerns about continued dryness in the U.S. Midwest is underpinning corn and soybeans. Farmers and traders now want to see rain actually falling and not just forecast, despite some rain in the forecasts this […]
May WASDE

Ending Stocks Corn💠2,222 MMT (est 2105M; prev 1342M) Soybeans💠335 MMT (est 292M; prev 210M) Wheat 💠556 MMT (est 608M; prev 598M) CORN USDA has released its initial production forecast for the 2023-24 new crop corn, projecting a record production of 15.265 billion bushels. This would surpass the previous record set in 2016. The USDA expects […]
USDA Grain Export Sales

Corn Rebounds, Soybeans and Wheat Drop. Corn💠257,279 MT Soybeans💠62,170 MT Wheat 💠26,263 MT The risk of loss in trading futures and/or options is substantial and each investor and/or trader must consider whether this is a suitable investment. Past performance, whether actual or indicated by simulated historical tests of strategies, is not indicative of future results.
USDA Export Sales: Corn, Soybean Exports Drop, Wheat Improves.

Corn💠312,442 MT Soybeans💠100,101 MT Wheat 💠259,039 MT Corn and soybean sales each missed their respective pre-report range for week ended April 13, though weekly wheat sales of 259,000 MT were 1 MT short of topping the pre-report range. Export commitments are 32.8% behind a year-ago compared to 32.3% behind last week. USDA projects exports in […]
April WASDE Report

USDA WASDE Leaves Corn, Soybeans Unchanged. Wheat Ending Stocks Rose as Expected. Corn💠295.4 MMT Soybeans💠100.3 MMT Wheat 💠265.1 MMT CORN-The USDA did not make many changes to the corn supply and demand for the 2022-23 crop, as the ending stocks remained unchanged at 1.342 billion bushels (bb), despite pre-report estimates that anticipated a reduction. Additionally, […]
Grain Export Inspections; Soybeans and Wheat Lower, Corn Turns Higher

USDA Export Inspections Week Ending 3/2 Corn💠899,810 MT Since last week, there have been 250,507 MT more export checks. In comparison to last week, inspections are currently 38.3% behind where they were a year ago. Exports are expected to total 1.925 billion bu. in 2022–2023, a 22.0% decrease from the prior marketing year. […]
Is the Corn Market Moving Towards 7.30 Gap?

Is the Corn Market Moving Towards 7.30 Gap? The Corn Market has been carving out a flag formation for the past 6 months. Lower highs and Higher lows have kept traders waiting. Annual lows during our typical seasonal high period, have juked out traders in the last 6 months. This also isn’t our first time […]
January WASDE Sends Bulls Charging. Corn, Soybeans Hit 2-week High.

USDA Thursday tightened its estimates for U.S. wheat, corn and soybean stocks. The forecast was higher than expected by analysts, helping to boost futures prices. January WASDE- Grain Futures saw a solid Thursday following the release of USDA’s latest World Agricultural Supply and Demand Estimates report. Corn prices saw a modest improvement after the agency […]