Is the Corn Market Moving Towards 7.30 Gap?
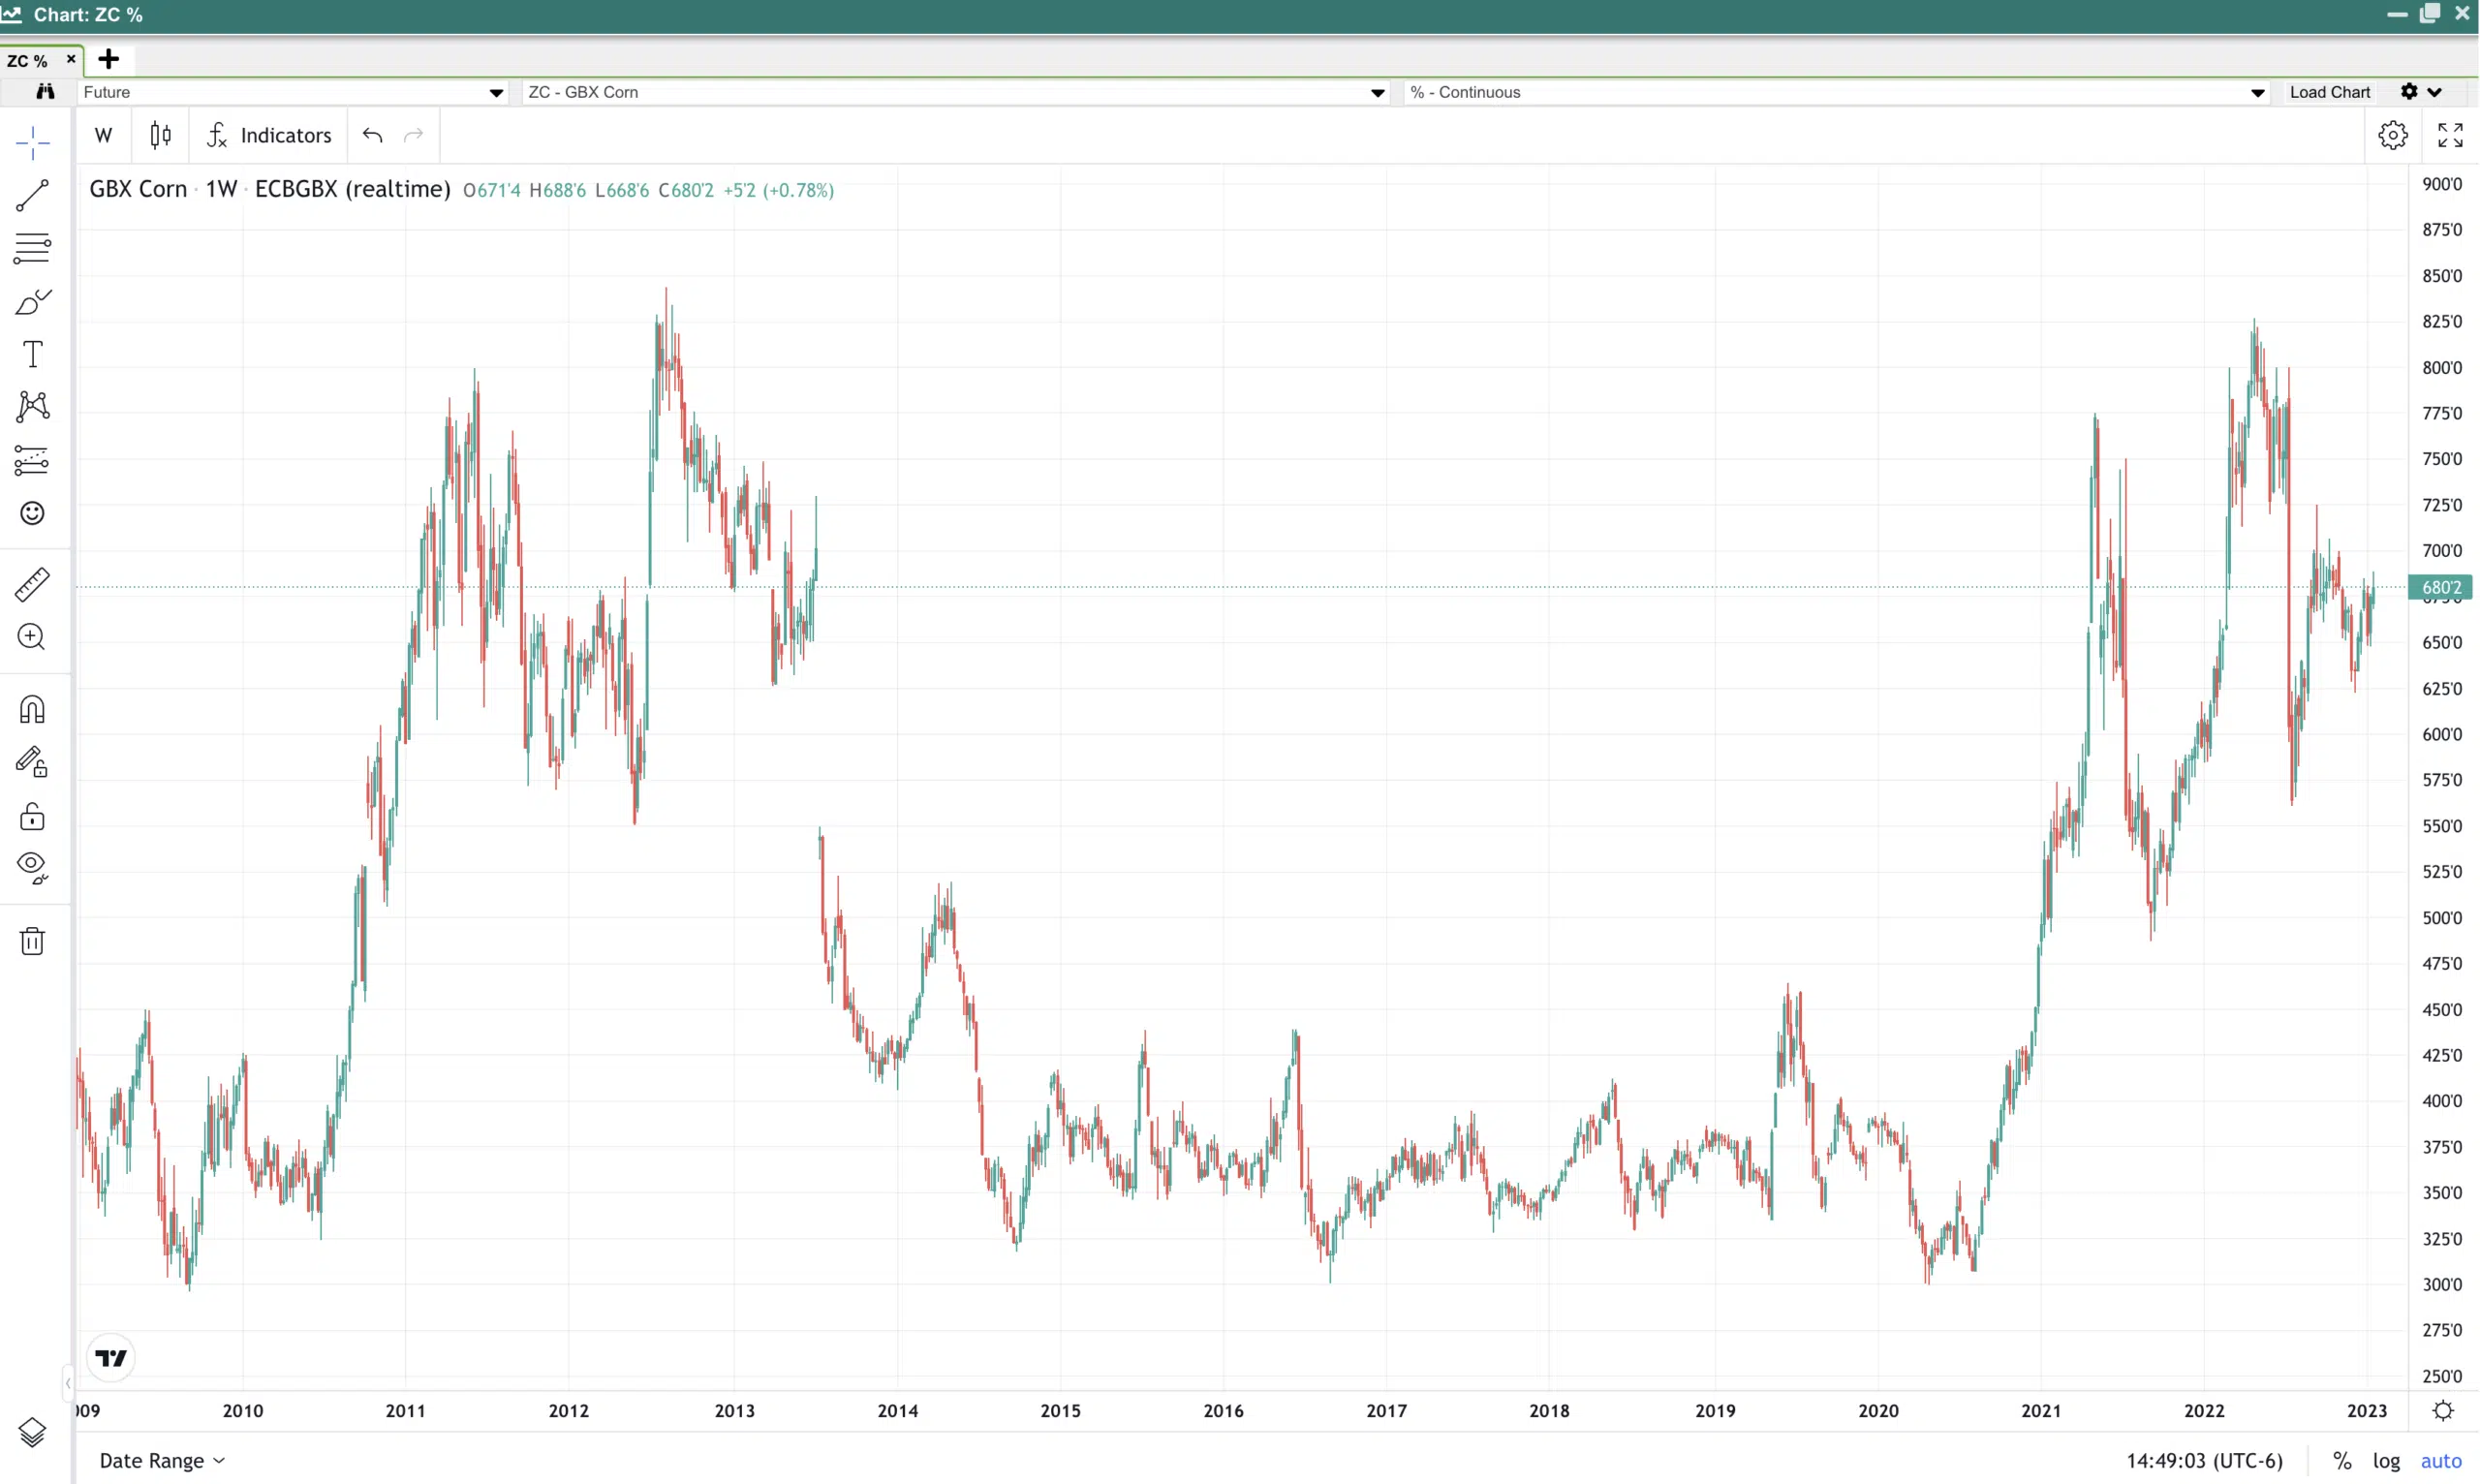
The Corn Market has been carving out a flag formation for the past 6 months. Lower highs and Higher lows have kept traders waiting. Annual lows during our typical seasonal high period, have juked out traders in the last 6 months. This also isn’t our first time breaking out of the flag formation. As you can see corn has gotten both the bulls and the bears on fake breakouts recently.
Last week, the USDA released a major data dump of Quarterly Stocks, Winter Wheat seeding acres, monthly WASDE, and Crop Production reports, causing corn prices to rise. The USDA reduced the projected 2022 harvested acres of corn by 1.6 million acres due to the western corn belt experiencing one of its driest summers on record. The demand for feed crops by livestock producers also shifts the demand for harvested acres for grain, which can also contribute to the increase in corn prices.
Corn Markets Historical Patterns
Corn shows seasonal strength to continue into March. Allowing the market plenty of time for the potential to close the 7.3225 price gap. I suspect the market to find some resistance at the 7.00 board price as producers continue to offload their 2022 crop and pay down operating notes. This has become a talking point for many producers this year. The cost of production to raise corn in South West Minnesota, NW Iowa, and SE South Dakota has climbed to $800-$1,100 per acre. The typical interest rate on an operating loan is around 7.25%. These are the dynamics producers are playing out and will want to operate on more cash than they have in recent years.
Corn Market: Balance Sheet
From a Global perspective according to the January WASDE report the Corn carryout has shrunk to 322.32 Million Metric tons compared to 324.27 Million Metic tons from the December estimate. Even after a year of historically higher prices, the carry-out shrunk.
A few things that factor into this is the globe is coming off 2 years of a La Nina weather pattern. La Nina patterns oftentimes lead to a drier upper midwest in the U.S. which is a core part of corn production. La Nina can also have an adverse effect on crop growth in South America. La Nina will oftentimes keep Northern Brazil wetter than normal and Argentina drier than normal.
Ukraine’s war with Russia continues. This makes crop production, and transportation particularly difficult in this region. At 41 Million Metric Tons Ukraine was the world’s 6th largest corn producer before the war. Estimates for this coming crop year have taken about 20-25% off normal production levels.
Corn Market Outlook
If you are interested in trading or hedging in the corn market and are looking to open a futures account give us a call or simply click this link to get started.
The risk of loss in trading futures and/or options is substantial. Each investor and/or trader must consider whether this is a suitable investment. Past performance, whether actual or indicated by simulated historical tests of strategies, is not indicative of future results