")
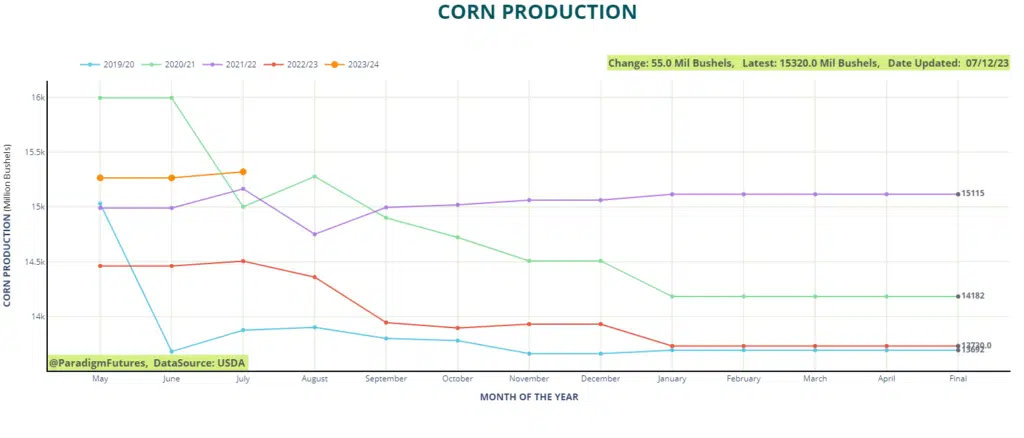
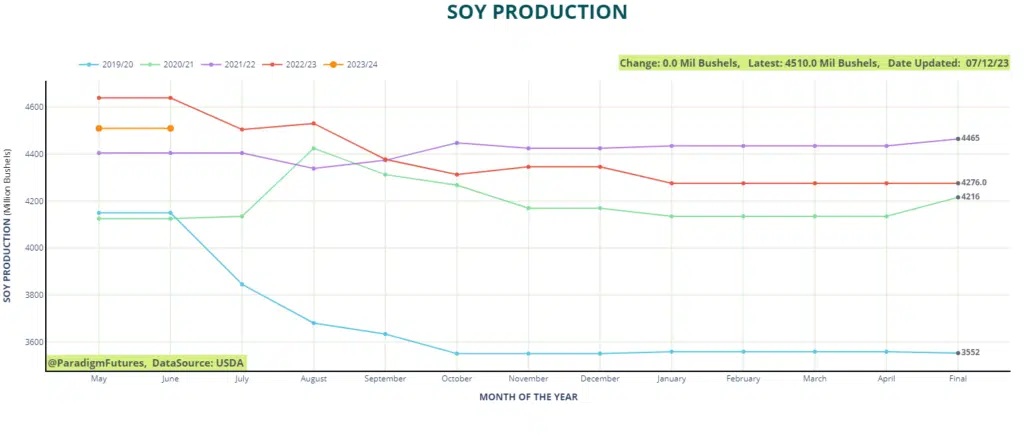
he USDA has projected a corn production of 15.320 billion bushels for 2023, with a yield of 177.5 bpa. This projection shows a slight increase compared to last month’s estimate, which was 15.265 billion bushels with a yield of 181.5 bpa. Turning to soybeans, the projected production for 2023 is 4.3 billion bushels, in contrast to last month’s figure of 4.510 billion bushels. It is worth noting that the decrease in US soybean production for 2023 is primarily attributed to a reduction in acres, as outlined in the June 30 Acreage Report
Corn
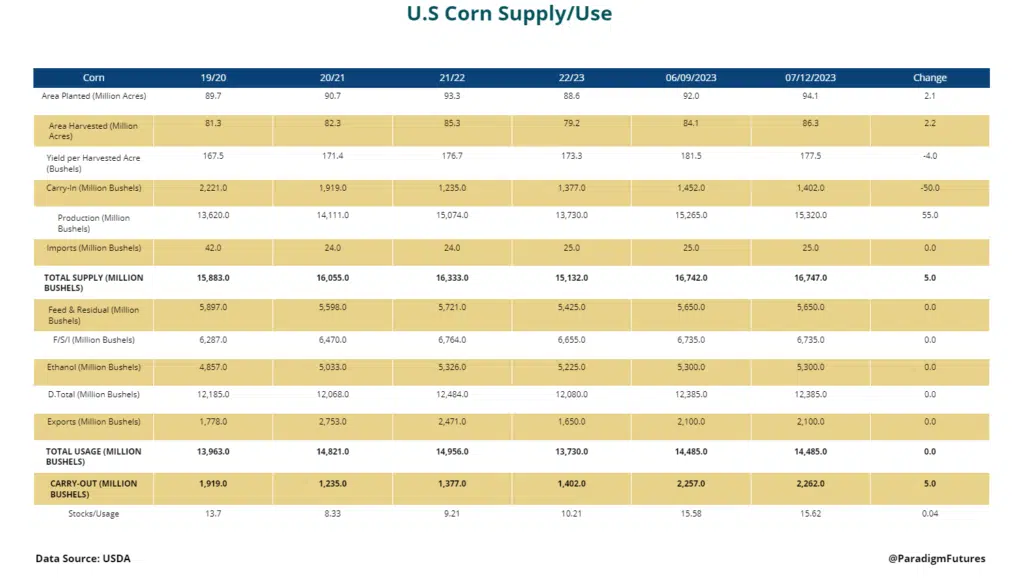
In terms of US highlights, corn exports for 2022-2023 are expected to decrease by 75 million bushels, and corn for ethanol is projected to decrease by 25 million bushels.
Soybeans
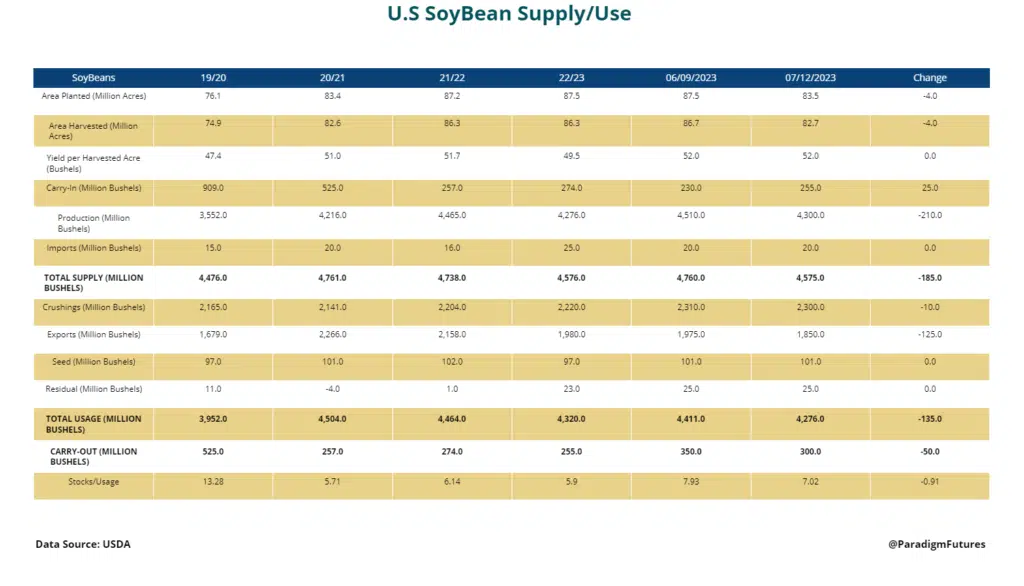
Most recent expectations regarding soybean exports for the 2022-2023 period will decrease by 20 million bushels. However, there is no change expected in the crush volume, which remains unchanged.
Shifting our focus to the global scenario, Brazil’s soybean production continues to hold steady at 156 million tons, while Argentina’s soybean production remains unchanged at 25 million tons. On the corn front, Brazil’s production is estimated to reach 133 million tons, slightly higher than the previous month’s projection of 132 million tons.
Notably, the USDA projects that China will import 99 million tons of soybeans during the current marketing year. This figure indicates a slight increase from the 98 million tons reported in the previous month’s update
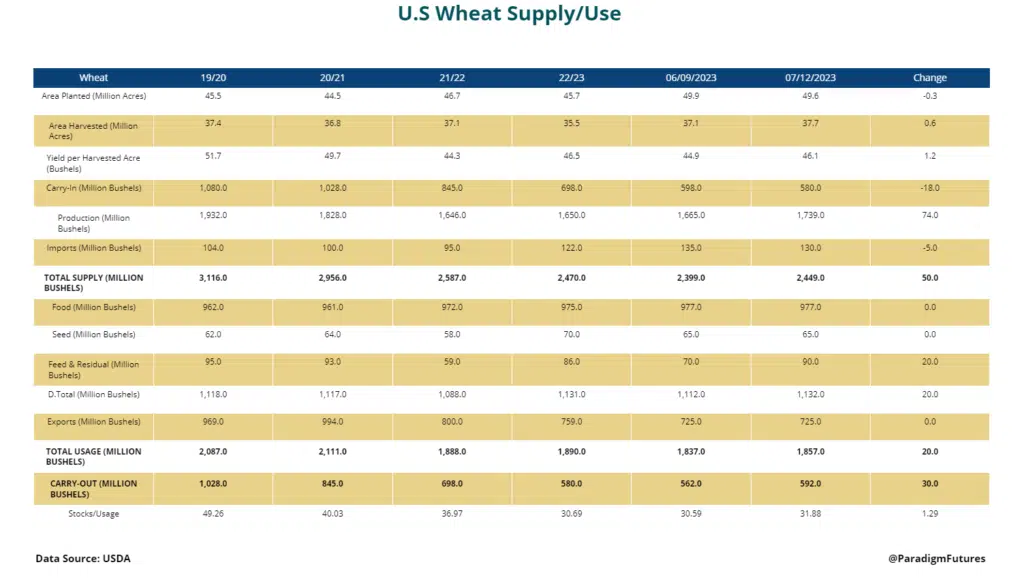
Wheat
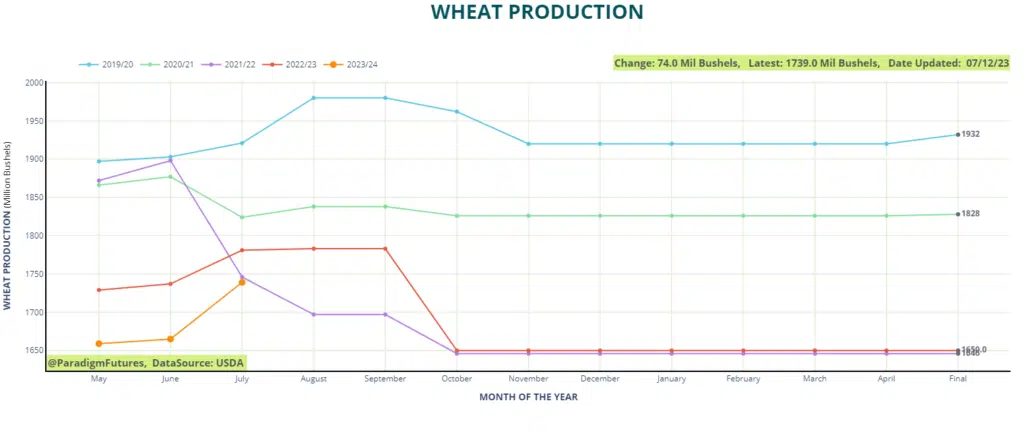
Notable Takeaways
The release of the USDA report at noon had a notable impact on commodity prices. Corn prices declined by 17 cents, soybean prices dropped by 32 cents, and wheat prices saw a decrease of 25 cents. Prior to the report, there were mixed trends observed, with corn down 5 cents, soybeans up 10 cents, and wheat down 8 cents.
Looking at the USDA’s estimates for US ending stocks in the 2023-2024 period, we find the following figures: corn – 2.362 billion bushels (compared to last month’s 2.257 billion bushels), soybeans – 300 million bushels (previously 350 million bushels), and wheat – 580 million bushels (previously 562 million bushels). Trader estimates for the same period are slightly lower: corn – 2.166 billion bushels, soybeans – 206 million bushels, and wheat – 565 million bushels.
Turning to the ending stocks projection for the 2022-2023 period, the USDA forecasts corn at 1.402 billion bushels (compared to last month’s 1.452 billion bushels), soybeans at 255 million bushels (previously 230 million bushels), and wheat at 592 million bushels (previously 598 million bushels). Trader estimates for the same period are as follows: corn – 1.406 billion bushels, soybeans – 235 million bushels, and wheat – 583 million bushels.
In terms of existing crop supplies, there is an expectation of a reduction in exports for old crop corn by 75 million bushels and old crop soybeans by 20 million bushels.
The weather conditions in the central US Midwest will play a crucial role in the next two weeks as corn pollination accelerates. So far, the region has not experienced prolonged periods of excessive heat this year, making the weather situation a key factor to watch