")
New Crop Corn and Soybeans sales come in strong.
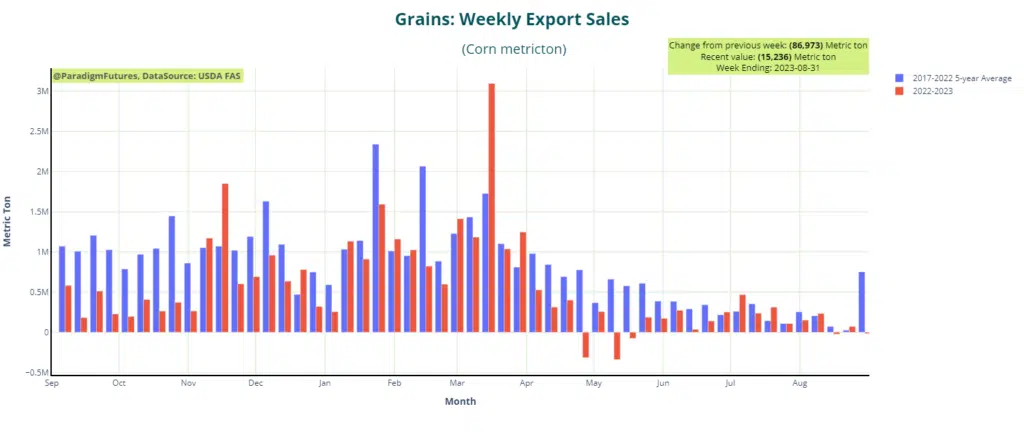
Corn🔹949,700 MT (23/24 MY)
-15,236 MT (22/23 MY)
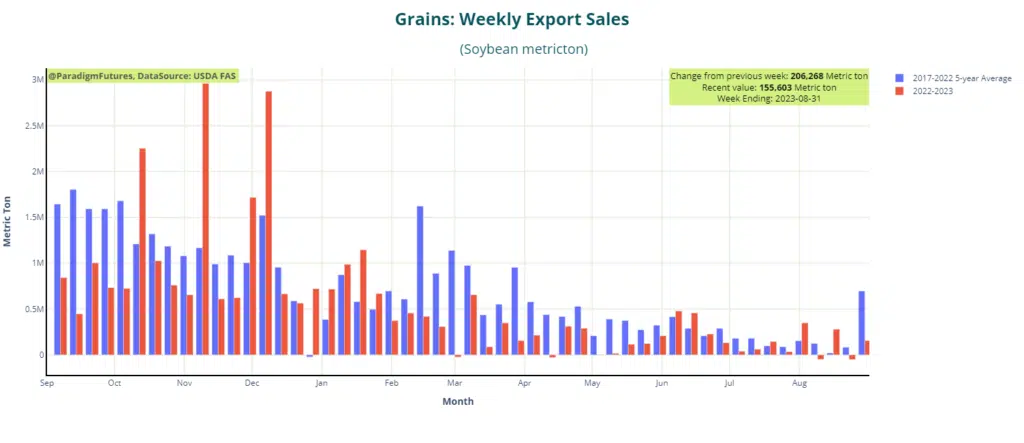
Soybeans🔹1,783,100 MY (23/24 MY)
155,603 MT (22/23 MY)
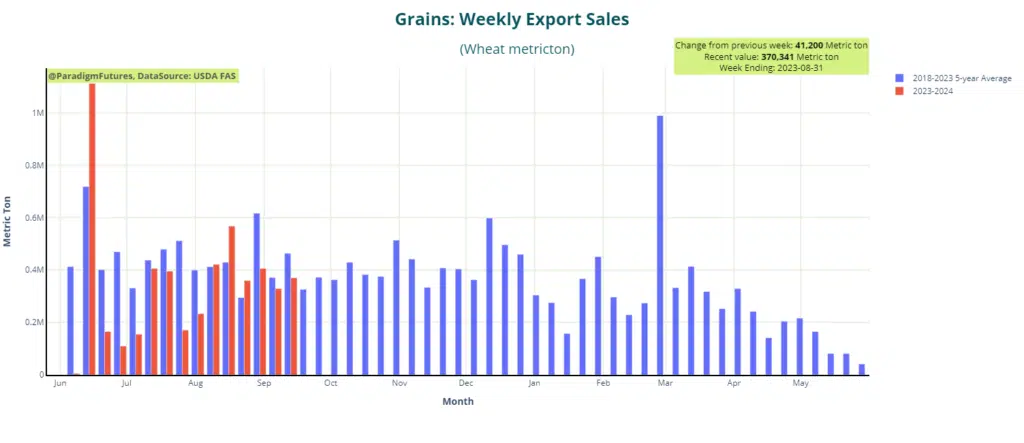
Wheat 🔹370,341 MT (23/24 MY)
The Department of Agriculture, in its weekly export sales report, stated that for the week ending on Aug. 31, sales of corn in 2023/24 totaled 949,700 metric tons, soybeans totaled 1.78 million tons, and wheat sales totaled 370,300 tons.
All three figures fell within the range of estimates provided by surveyed analysts for the week. They had predicted corn sales to range between 300,000 and 1.4 million tons, soybeans between 1.3 million and 2.5 million tons, and wheat between 200,000 and 650,000 tons.
However, carryover sales from the 2022/23 marketing year were either light or non-existent. The USDA reported a net reduction of 15,200 tons for corn carryover sales, while soybeans saw sales of 155,600 tons.
For the week, Mexico emerged as the leading buyer of corn, while unknown destinations led in soybean purchases, and Taiwan was the top buyer of wheat.
Pre-market trading in grain futures on the CBOT showed an increase, with corn up by 0.3%, soybeans by 0.1%, and wheat by 0.1%