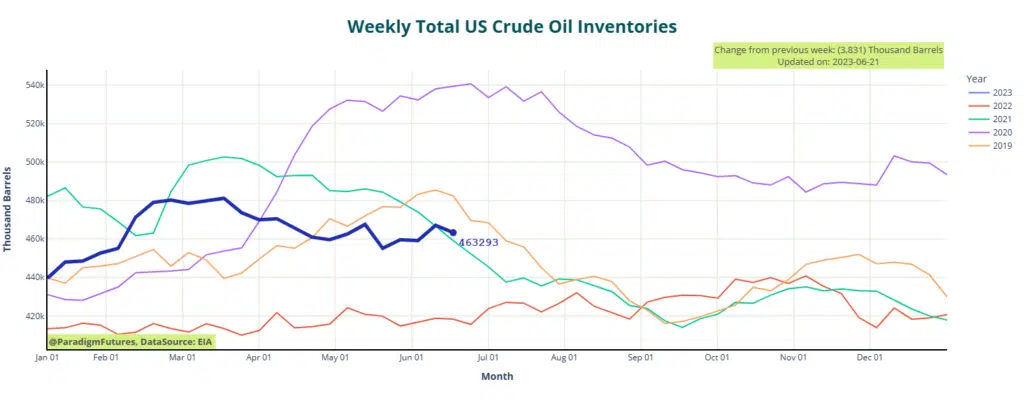
- Crude Inventories down 🔽 3.8M bbl
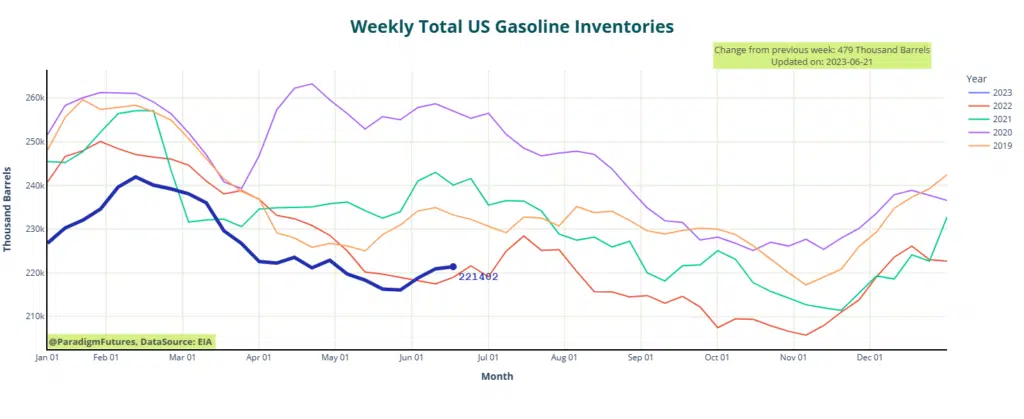
- Gasoline up 🔺479k bbl
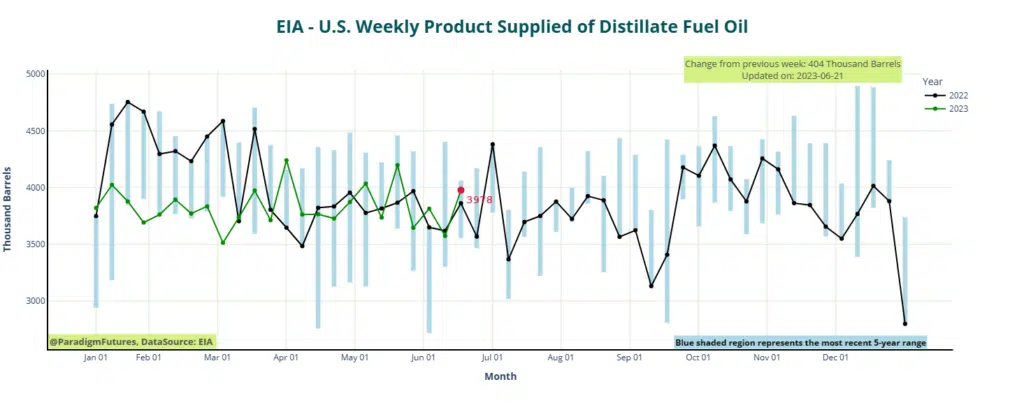
- Distillates up 🔺400k bbl
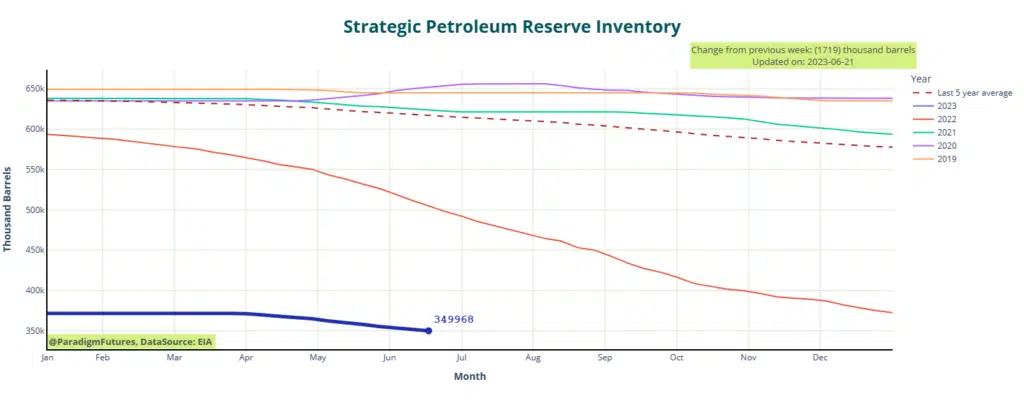
- SPR down 🔽 1.7M bbl
- Domestic prod: 12.2 MMbpd
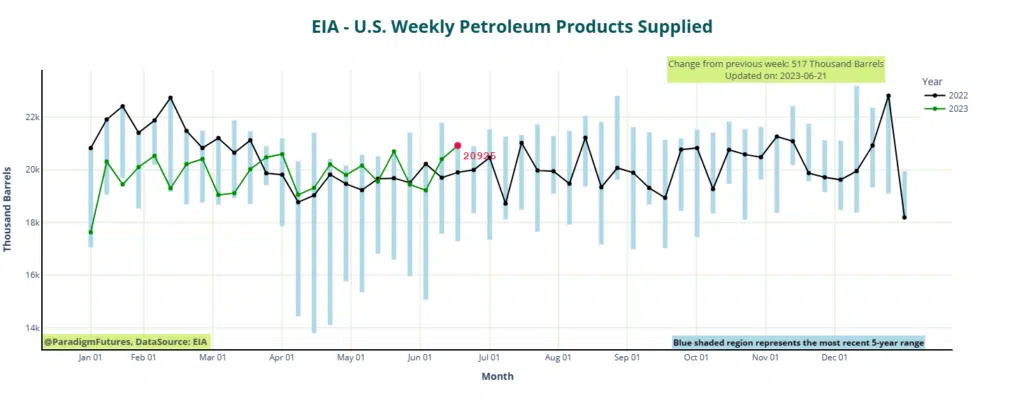
- Impld gas demand: 9.38 Mbpd
- Ethanol 🔽 down 578k bbl
The Energy Information Administration reported on Thursday that strong export demand and reduced imports contributed to a surprising draw in U.S. crude stocks during the last week. Crude inventories decreased by 3.8 million barrels to reach 463.3 million barrels in the week ending June 16. This outcome differed significantly from analysts’ predictions in a Reuters poll, which anticipated a 300,000-barrel increase. In the same period, however, gasoline and distillate inventories experienced a rise.
According to the EIA, gasoline stocks in the United States increased by 500,000 barrels to reach 221.4 million barrels during the week. This result deviated from analysts’ expectations in a Reuters poll, which had projected a 100,000-barrel rise.
Additionally, distillate stocks, including diesel and heating oil, saw a climb of 400,000 barrels to reach 114.3 million barrels, as per the EIA data. This was contrary to expectations for a 700,000-barrel increase.
In terms of refinery operations, the EIA reported a decline of 116,000 barrels per day in refinery crude runs during the last week. Furthermore, refinery utilization rates dropped by 0.6 percentage points to
93.1%
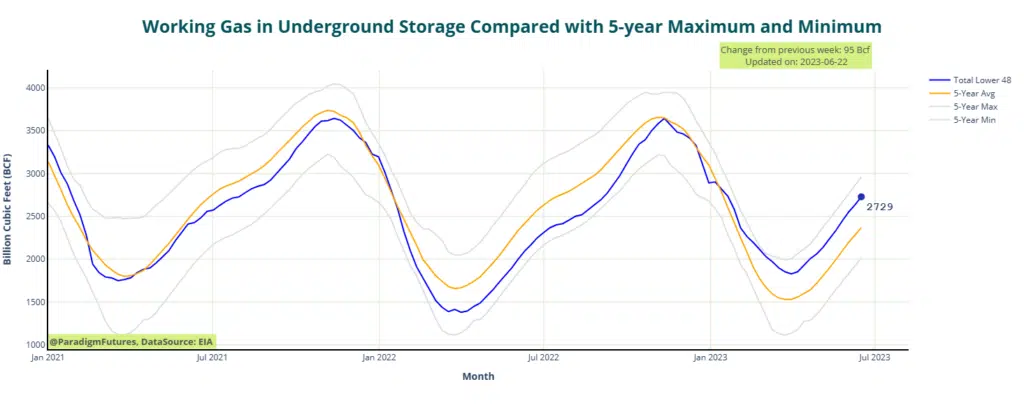
EIA Natural Gas Storage
For the week ending June 16, net injections into storage amounted to 95 Bcf, surpassing the five-year (2018-2022) average net injections of 86 Bcf and the previous year’s net injections of 76 Bcf during the same period. Working natural gas stocks reached a total of 2,729 Bcf, representing a surplus of 362 Bcf (15%) compared to the five-year average and a surplus of 571 Bcf (26%) compared to the previous year at the same time.
According to The Desk survey of natural gas analysts, estimates for the weekly net change in working natural gas stocks ranged from 88 Bcf to 98 Bcf, with a median estimate of 91 Bcf.
During the refill season (April through October), the average rate of injections into storage currently stands 8% higher than the five-year average. If the rate of injections into storage matches the five-year average of 9.0 Bcf/d for the remainder of the refill season, the total inventory by October 31 would amount to 3,957 Bcf, exceeding the five-year average of 3,595 Bcf for that time of year by 362 Bcf.