John Caruso

Senior Market Strategist
Good morning,
Market Insight:
*Eurozone CPI mm -0.2% vs -0.2% exp vs -0.4% prev.
*Eurozone CPI yy 8.6% vs 8.6% exp vs 8.5% prev.
*BoE’s Mann: Further tightening and sooner rather than later likely is needed
*US Fed Swaps upgrade bets on 25pbs hike in June to nearly a certainty
FOMC Minutes (yesterday): Participants showed concern that the tight labor market would act as a headwind towards their fight against inflation. While they’re pleased to see inflation easing since the back end of 2022, all members agreed they need to see more progress. Several members of the Fed advocated raising rates by 50bps. Some members inside the Fed upgraded the likelihood of a recession in 2023. All-in-all it was hawkish.
Stocks: I’m sure you noticed the immediate OS conditions in stocks (OB condition in the VIX) inside of yesterday’s note. We are getting a slight rebound in equities this morning, alleviating the OS conditions. However, we’ve now seen the major indices lose their positive momentum conditions and are still of the view that rallies from here are likely to fail.
Bond Yields: Just 3 weeks ago the 10yr yield was at 3.34%, whereas today we sit at 3.92% !! That’s a gigantic move in yields in that short period of time as it clearly appears as if the Fed is not finished with it rate hike cycle. Jim Bullard was out early yesterday stating his base case was for the Fed terminal rate to move to 5.375%. So with headline yy CPI at 6.4% – are we in a position to doubt that the Fed will make it to 6%? I’m not so sure myself.
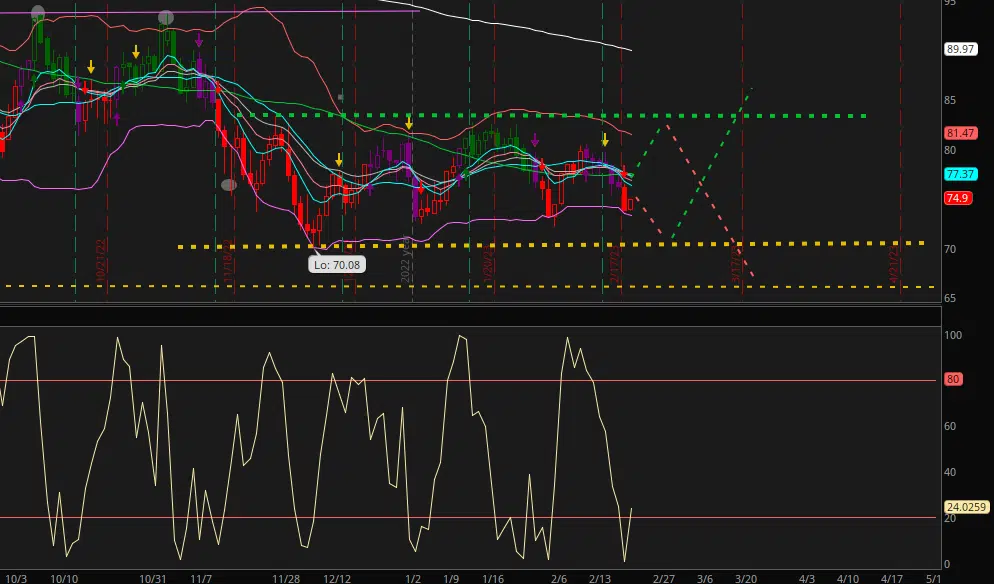
Oil: I get asked about Oil a lot, so here’s my analysis – it’s likely going higher over the long run, but you can’t rule out a breakdown to lower prices into the mid-60s first. We know the economic conditions are slowing, and likely to begin to slow faster we estimate over the next 60-90 days. If Oil does move into the 60s and breaks down from its current sideways range – I think you can buy it on value. If Oil were to break above 83.50-83.90 – I think you can buy it on momentum, and the a breakout from this $11 sideways trading range.
| Market | Trend > 6 mo | Range Low | Range High | Momentum | OB/OS |
| SP500 | Bearish | 3993 | 4115 | Neutral | 25 |
| Nasdaq 100 | Bearish | 11,928 | 12,492 | Neutral | 30 |
| Russell 2000 | Bearish | 1878 | 1946 | Neutral | 45 |
| 10yr Yield | Bullish | 3.65% | 4.02% | Positive | 69 |
| VIX | Bullish | 19.76 | 22.47 | Positive | 59 |
| Oil | Bearish | 73.26 | 78.37 | Neutral | 22 |
| Gold | Bullish | 1816 | 1885 | Negative | 36 |
| USD (CASH) | Bullish | 103.13 | 105.07 | Positive | 69 |
| Copper | Bullish | 398 | 421 | Positive | 52 |
| Silver | Bullish | 20.96 | 22.48 | Negative | 37 |
*The risk of loss in trading futures and/or options is substantial and each investor and/or trader must consider whether this is a suitable investment. Past performance, whether actual or indicated by simulated historical tests of strategies, is not indicative of future results.