PPI Comes In Hot, Increasing .7%
- PPI ⬆️ .7%
- Final Demand Less Energy, Food, Trade ⬆️ 4.5%
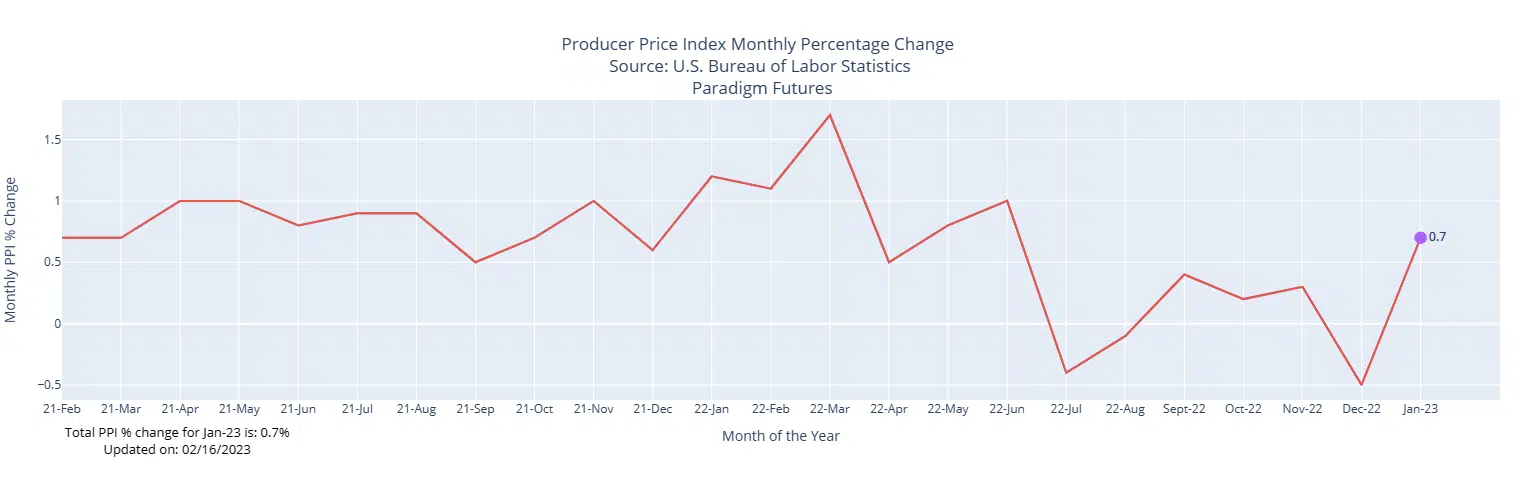
The Producer Price Index for final demand increased 0.7 percent in January, seasonally adjusted, the
U.S. Bureau of Labor Statistics reported today. Final demand prices declined 0.2 percent in December
2022 and advanced 0.3 percent in November. (See table A.) On an unadjusted basis, the index for final
demand rose 6.0 percent for the 12 months that ended January 2023.
In January, a 1.2-percent rise in prices for final demand goods led an advance in the final demand
index. Prices for final demand services also moved higher, increasing by 0.4%.
The index for final demand less foods, energy, and trade services rose 0.6 percent in January 2023, the
largest advance since moving up 0.9 percent in March 2022. For the 12 months that ended in January 2023,
prices for final demand, less foods, energy, and trade services increased 4.5 %
Final Demand
The largest increase in the index for final demand goods occurred in January, rising by 1.2 %, which is the largest increase since it rose by 2.1 % in June 2022. The majority of the January advance is due to a 5.0-percent jump in prices for final demand energy. On the other hand, prices for final demand foods fell by 1.0 percent, while the index for final demand goods less foods and energy increased by 0.6 %.
A closer look at product detail reveals that nearly one-third of the January rise in the index for final demand goods can be attributed to prices for gasoline, which increased by 6.2 %. Other indexes that saw an increase include residential natural gas, diesel fuel, jet fuel, soft drinks, and motor vehicles. In contrast, prices for fresh and dry vegetables decreased by 33.5%. While the indexes for residual fuels and basic organic chemicals also declined (see table 2).
The index for final demand services also saw an advancement in January, increasing by 0.4 %, which is the same as in December. Over 80 percent of the broad-based increase is due to prices for final demand services less trade, transportation, and warehousing, which rose by 0.6 %. Margins for final demand trade services moved up 0.2 %. While prices for final demand transportation and warehousing services also saw an increase of 0.2 percent.
Taking a closer look at product detail, the index for hospital outpatient care saw a jump of 1.4 %, which is a significant factor in the January rise in prices for final demand services. Other indexes that saw an increase include automobiles and automobile parts retailing, health, beauty, and optical goods retailing, portfolio management, chemicals and allied products wholesaling, and airline passenger services. In contrast, margins for fuels and lubricants retailing fell by 17.5 %, while prices for long-distance motor carrying and securities brokerage, dealing, and investment advice also declined.
see the Full Report Here Producer Price Indexes – January 2023 (bls.gov)