John Caruso

Senior Market Strategist
Monday, 2/13 Market Risk
*EU raises 2023 growth forecast to 0.9% vs 0.3% prev.
*EU lowers 2023 inflation forecast to 5.6% vs 6.1% prev.
*Happy Birthday to my wife, Taylor
Last week was a reversal week or a “pause for the cause” type week following a very strong start to 2023 for US Equities. The SP500 -0.80%, NQ -1.8%, and the Russell -3.2% ww. Crude Oil had the best performing week in the commodity basket +8.2% following a -8.5% week previously. Powell was the highlight of last week’s “data set” – Powell was pretty steadfast in his hawkish tone, and stands by ready to do more if necessary. All-in-all, he remains data dependent, and if the jobs market continues to remain tight and inflation “sticky”, you shouldn’t expect to hear anything but a hawkish Powell. The market responded in kind.
This upcoming week will be another telling week for the market cycle as we’ll receive the CPI data exp 6.2% yy (Tuesday), Retails Sales exp 1.8% mm (Wednesday), and PPI exp 5.4% yy (Thursday). The one thing I found extremely noteworthy this past week was the rise in the 2yr yield (+45bps) – that is not telling us that a Fed pivot is imminent and in fact is increasing the odds of another 25bps hike for the May meeting (2 meetings from now). As for market predictions, we may have one more test higher back towards the YTD highs prior to a larger period of risk. Refer to the chart below for more analysis and immediate-term thoughts.
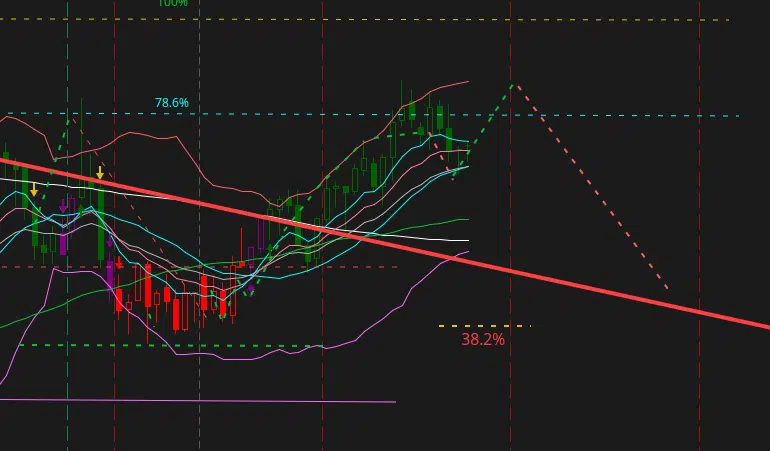
SP500 Daily Chart
The Sp500 is currently just coming off of immediate OS, with the VIX OB. We may have another look at the ytd highs prior to a larger period of risk into Mar and April. Based on the recent strength of the market, I’m very much open to the idea that the market low was put in back in OCTOBER (at least for the foreseeable future), and that the next period of market risk may only get as deep as 3800 in the SP500.
*Still getting immediate OS in NQ and RTY – Chart of the daily ES below.
*VIX looks to be bottoming, but immediate OB at range highs, could be another dip associated with recent OS condition in stocks
*10yr yields back to bullish trend
*Oil looks interesting, may be forming a “base” on the weekly. I’m keying off of last week’s median of 76.25 as a level that must hold for bulls on a retest.
*Gold lower low in the range. Buying zone may be lower bw 1830-1800.
*the entire metals complex is looking notably weaker this morning – as the idea of a Fed pivot gets pushed back.
| Market | Trend > 6 mo | Range Low | Range High | Momentum | OB/OS |
| SP500 | Bearish | 4013 | 4206 | Positive | 25 |
| Nasdaq 100 | Bearish | 12,082 | 12,952 | Positive | 13 |
| Russell 2000 | Bearish | 1911 | 2006 | Positive | 12 |
| 10yr Yield | Bullish | 3.46% | 3.76% | Positive | 91 |
| VIX | Bullish | 17.75 | 21.83 | Neutral | 78 |
| Oil | Bearish | 74.23 | 81.2 | Neutral | 88 |
| Gold | Bullish | 1855 | 1929 | Neutral | 31 |
| USD (CASH) | Bullish | 101.32 | 103.97 | Neutral | 63 |
| Copper | Bullish | 396 | 421 | Neutral | 72 |
| Silver | Bullish | 21.61 | 22.98 | Negative | 30 |