USDA Export Sales
- CORN- 1,160,300
- WHEAT- 131,400
- SOYBEANS- 459,400
- COTTON- 262,800
- BEEF- 16,400
- PORK- 28,800
Corn – 1,160,300 MT

Net sales of 1,160,300 MT for 2022/2023 decreased by 27 percent from the previous week. However, an increase of 19 percent compared to the prior 4-week average. Japan (388,200 MT), unknown destinations (308,200 MT), Mexico (107,000 MT, including a decrease of 28,900 MT), Guatemala (70,800 MT), and Panama (67,000 MT) primarily drove the increase. For 2023/2024, the total net sales were 10,000 MT, all for Japan.
Compared to a year-ago, export commitments are 41.4% behind, and 43.2% behind last week. The USDA projects exports in 2022-23 at 1.925 billion bu., a 22% decrease from the previous marketing year.
Wheat – 131,400 MT
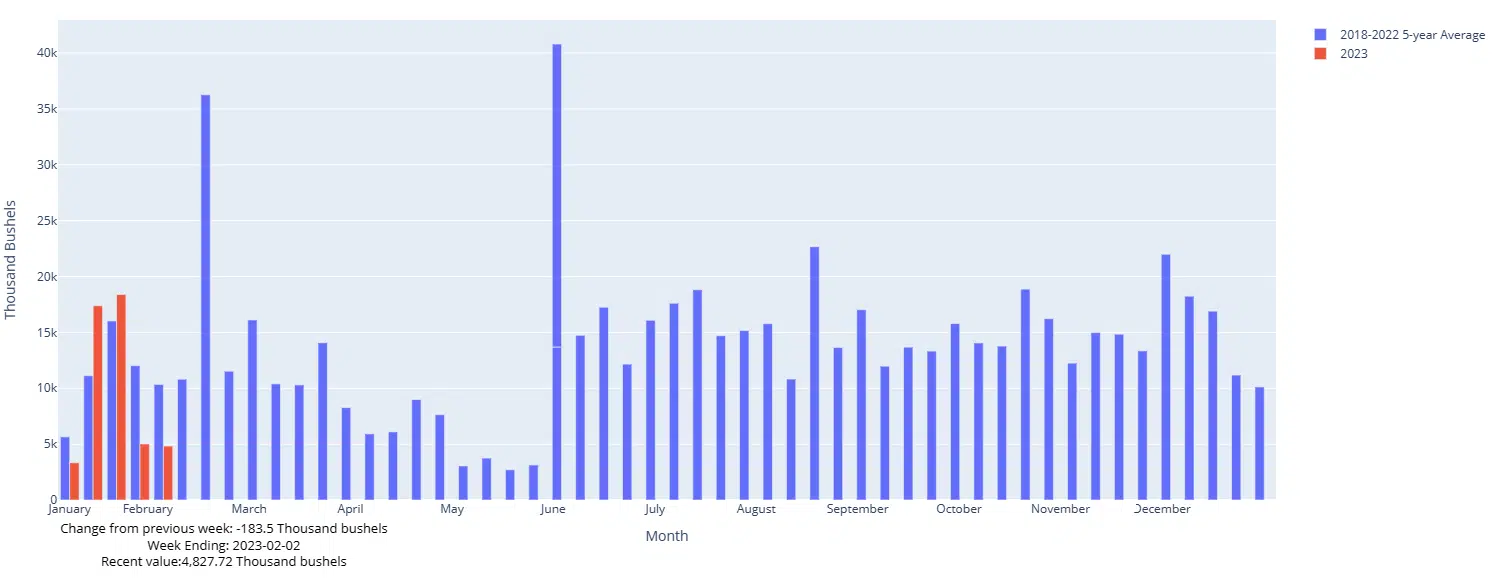
The net sales of 131,400 metric tons (MT) for 2022/2023 decreased by 4 percent from the previous week and 56 percent from the prior 4-week average. Increases in net sales, primarily for Mexico (76,000 MT, including a decrease of 300 MT), Colombia (43,600 MT, including 31,600 MT transferred from unknown destinations and a decrease of 800 MT), unknown destinations (39,000 MT), Ecuador (28,800 MT, including 19,400 MT transferred from unknown destinations), and Japan (26,000 MT), were offset by reductions primarily for South Korea (60,000 MT) and Iraq (47,900 MT). For 2023/2024, net sales of 19,500 MT were reported for Colombia (12,500 MT), Mexico (6,500 MT), and Panama (500 MT).
Export commitments are 6.0% behind last year, compared to 6.3% behind last week. The USDA projects exports in 2022-23 to be 775 million bu., a 3.1% decrease from the previous marketing year.
Soybeans – 459,400 MT
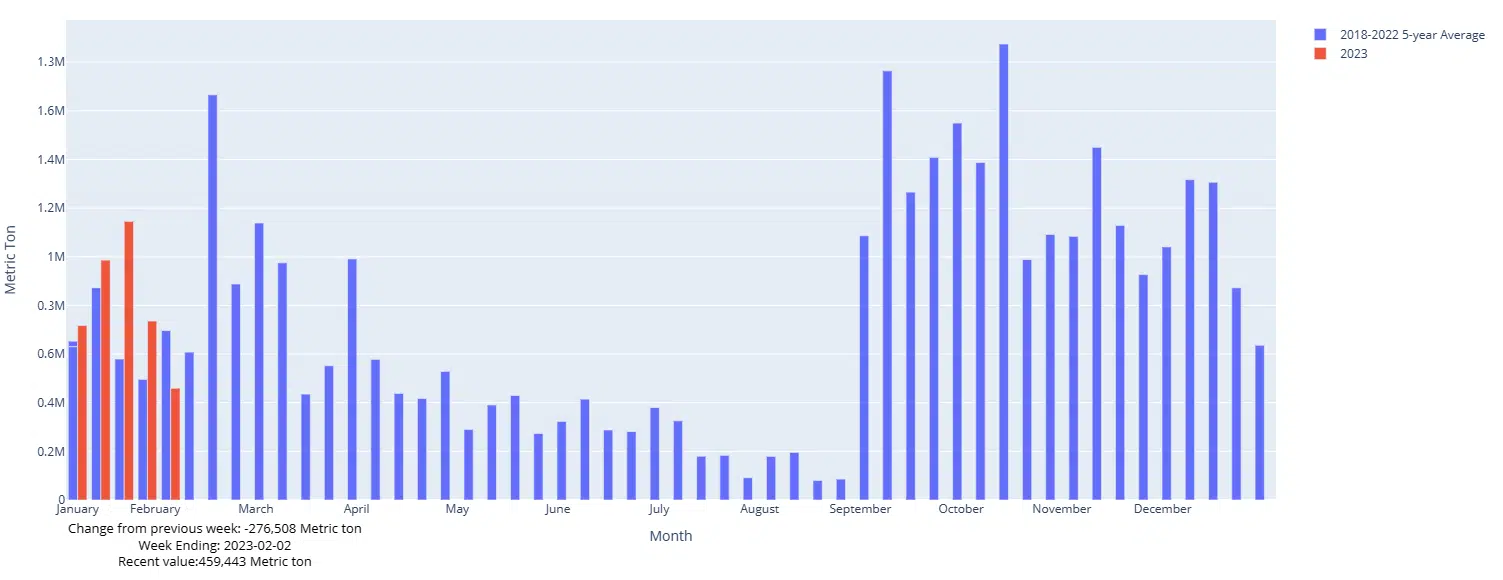
Net sales of 459,400 MT for 2022/2023 decreased by 38 percent from the previous week and 49 percent from the prior 4-week average. China (518,900 MT, including 332,000 MT transferred from unknown destinations, 52,000 MT transferred from Pakistan, and a decrease of 67,200 MT), Spain (139,600 MT, including 132,000 MT transferred from unknown destinations), the Netherlands (85,600 MT, including 77,000 MT transferred from unknown destinations), Indonesia (73,800 MT, including 55,000 MT transferred from unknown destinations, 300 MT transferred from Taiwan, and a decrease of 200 MT), and Colombia (26,700 MT, including 12,000 MT transferred from unknown destinations and a decrease of 1,200 MT) primarily drove the increase, while reductions were primarily reported for unknown destinations (387,000 MT). For 2023/2024, net sales of 185,000 MT were reported, with 132,000 MT for unknown destinations and 53,000 MT for China.
Export commitments are 2.1% ahead of last year, compared to 4.7% ahead last week. The USDA projects exports in 2022-23 to be 1.990 billion bu., a decrease of 8.0% from the previous marketing year.
Cotton – 262,800

Net sales of 262,800 RB for 2022/2023, a marketing-year high, increased by 54% from the previous week and 58% from the prior 4-week average. China (87,700 RB). Turkey (72,600 RB, with a decrease of 300 RB), Vietnam (45,300 RB). Indonesia (16,600 RB), and Pakistan (14,000 RB) primarily contributed to the increases, while reductions took place in El Salvador (400 RB) and Mexico (300 RB). For 2023/2024, net sales of 4,800 RB primarily went to Thailand (3,300 RB). Exports of 210,100 RB decreased by 1% from the previous week but increased by 17% from the prior 4-week average. Pakistan (45,200 RB), Vietnam (42,800 RB), China (40,300 RB), Turkey (18,900 RB) were the primary destinations. Net sales of Pima totaling 1,300 RB for 2022/2023 noticeably decreased from the previous week and by 50% from the prior 4-week average, with increases primarily going to Vietnam (700 RB) and Bangladesh (300 RB).
Beef – 16,400

Net sales of 16,400 MT for 2023 primarily went to South Korea (4,400 MT, with a decrease of 400 MT), Japan (3,500 MT, with a decrease of 400 MT), Mexico (2,700 MT), Canada (1,400 MT, with a decrease of 100 MT), and China (1,400 MT, with a decrease of 200 MT). The USDA projects that exports in 2022 will decrease by 12.8% from the previous year.
Pork – 28,800
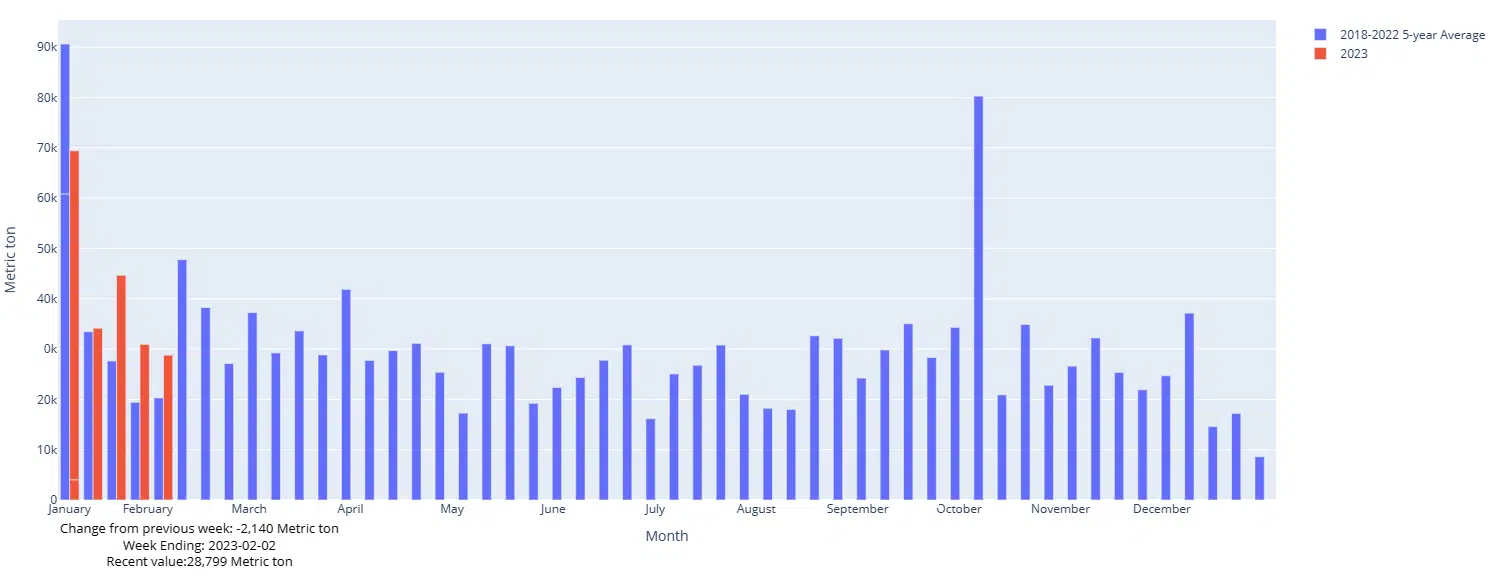
Net sales of 28,800 MT for 2023 were primarily for Mexico (12,700 MT, including decreases of 200 MT), South Korea (4,700 MT, including decreases of 1,200 MT), China (3,400 MT, including decreases of 200 MT), Colombia (1,600 MT, including decreases of 100 MT), and Australia (1,500 MT).