Crude Oil Price Fails to Show Signs of a Bottom
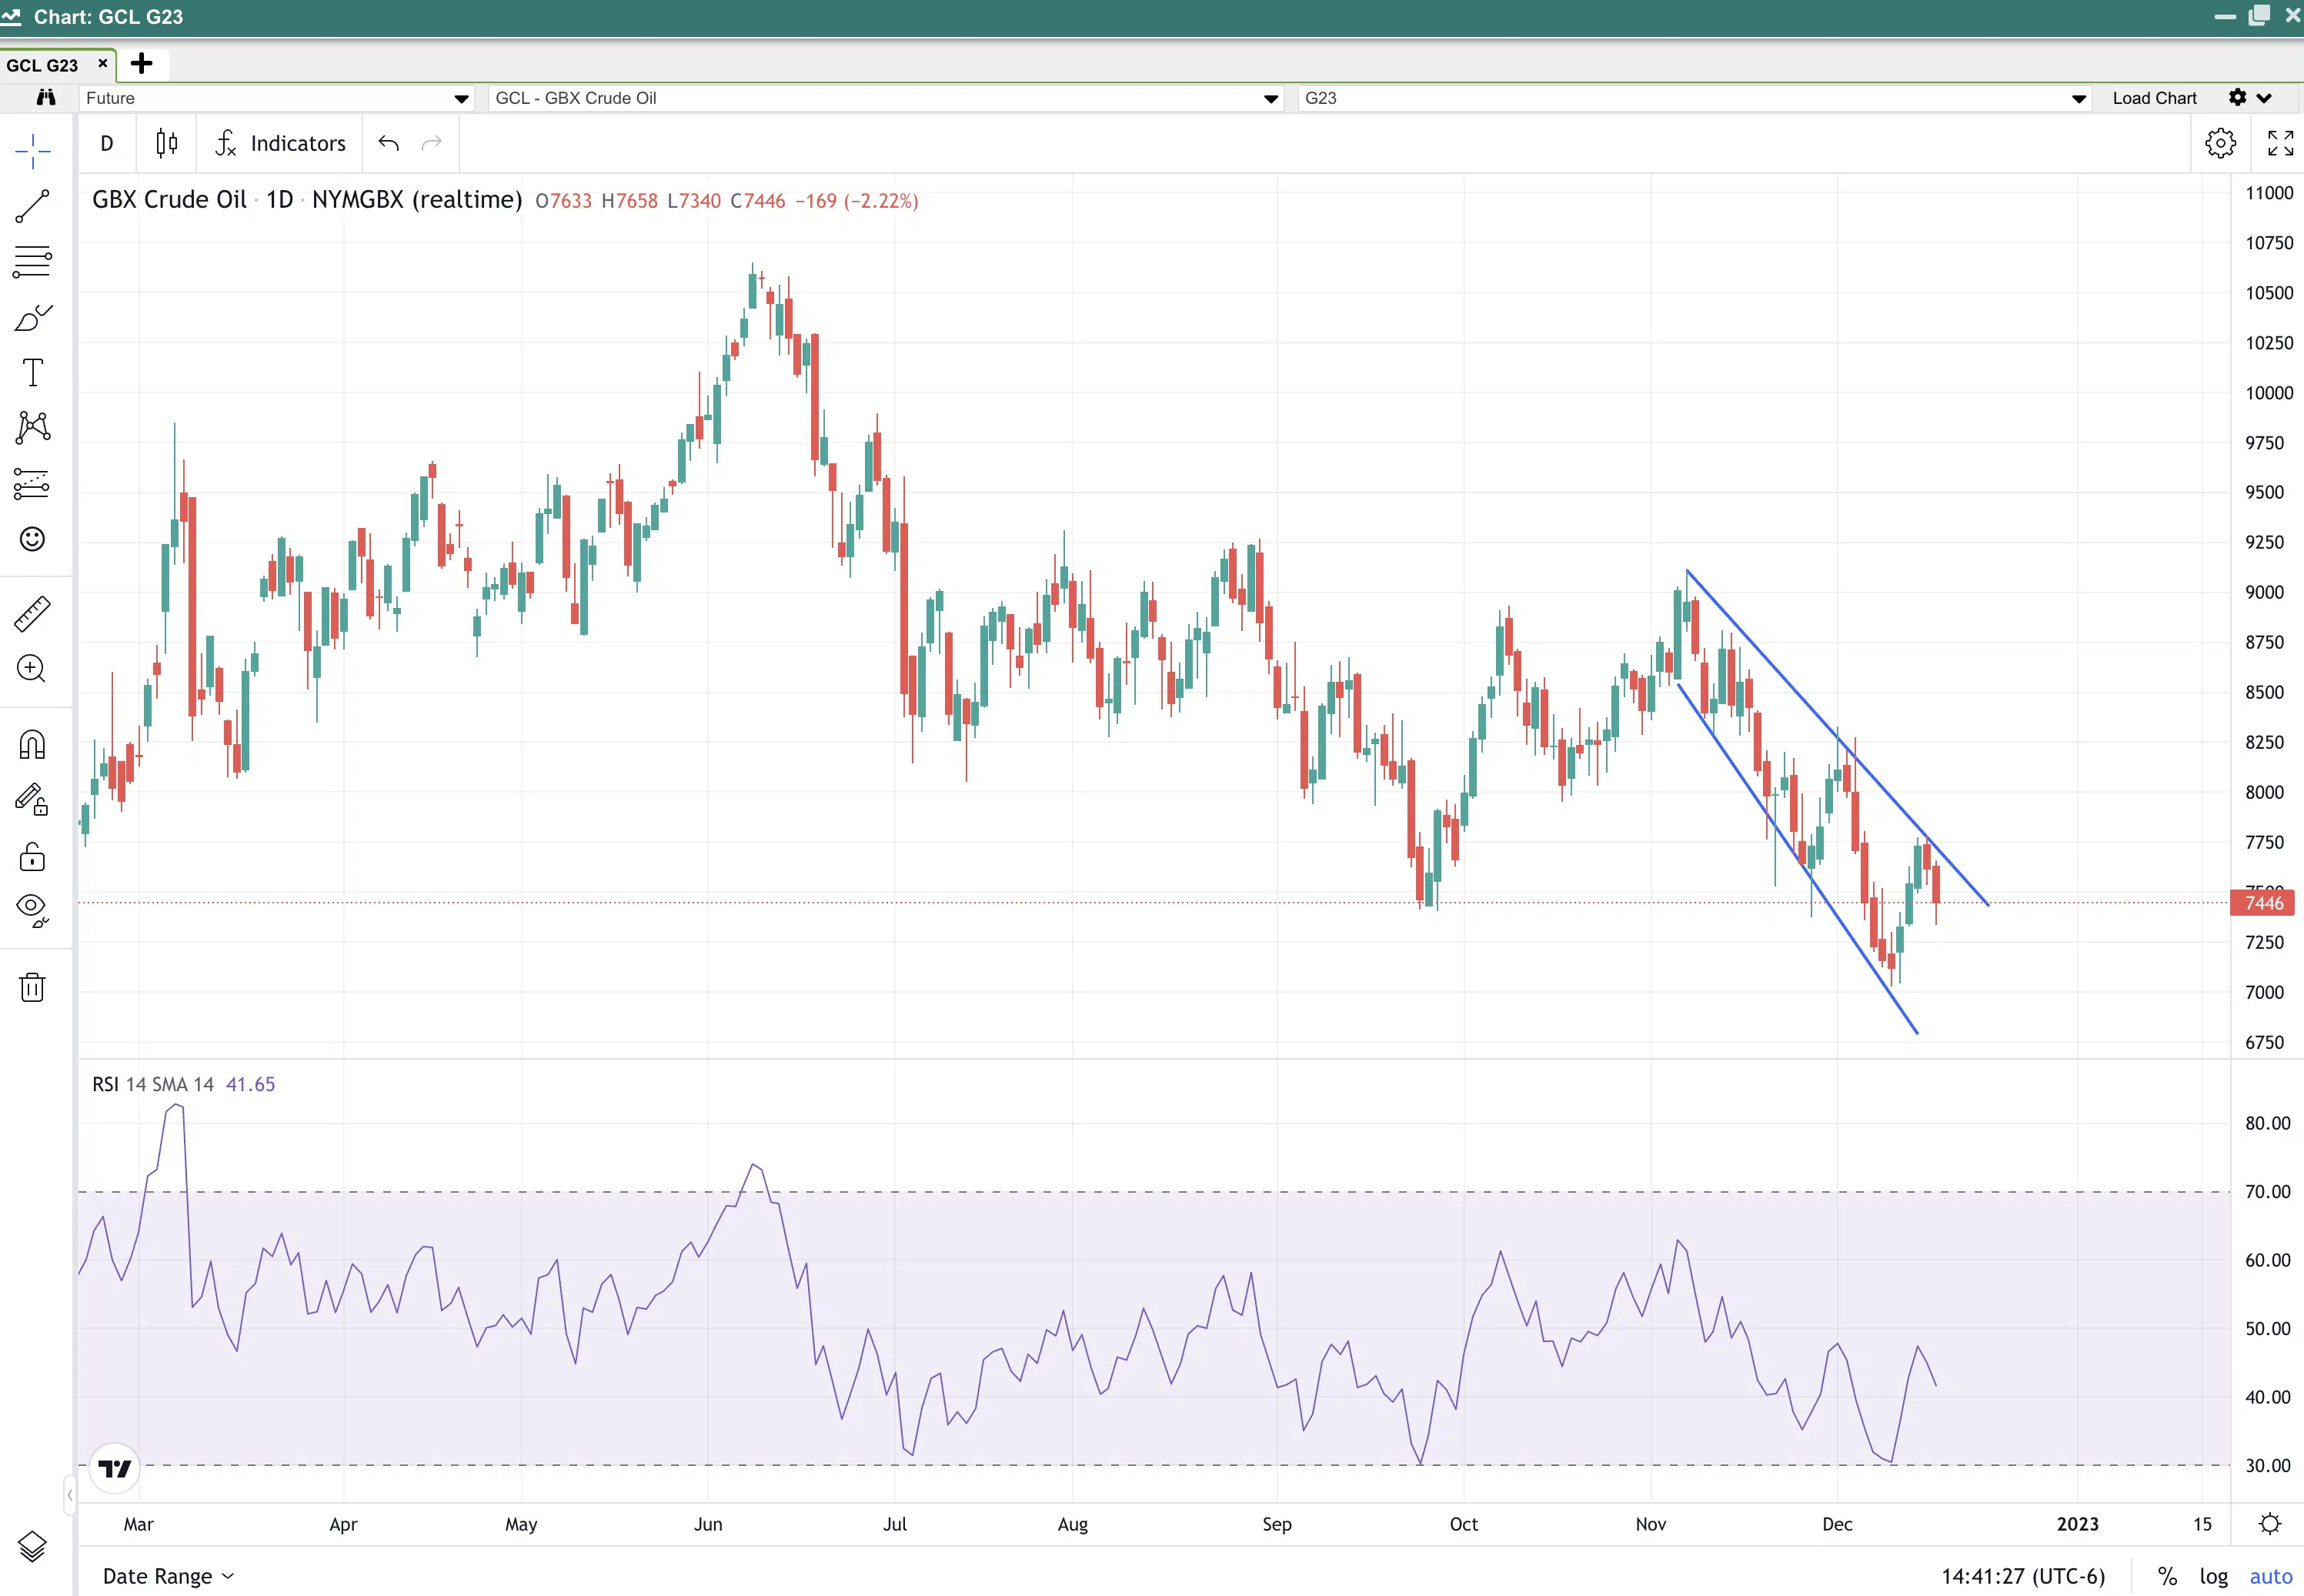
Crude oil Price continues to stay inside its downward channel and has yet to show signs of a price reversal. The current low we saw two weeks ago was not a strong reversal pattern. I see no real signs of support until we get closer to the 65-68 dollar level. If the market decides to push the price lower it will be important to keep an eye on how the Relative Strength Index reacts.
If prices make a new low but the RSI fails to also make a new low that would be considered a bullish divergence. So far the lows we have seen recently the RSI has also made a new low confirming that the price action is weak.
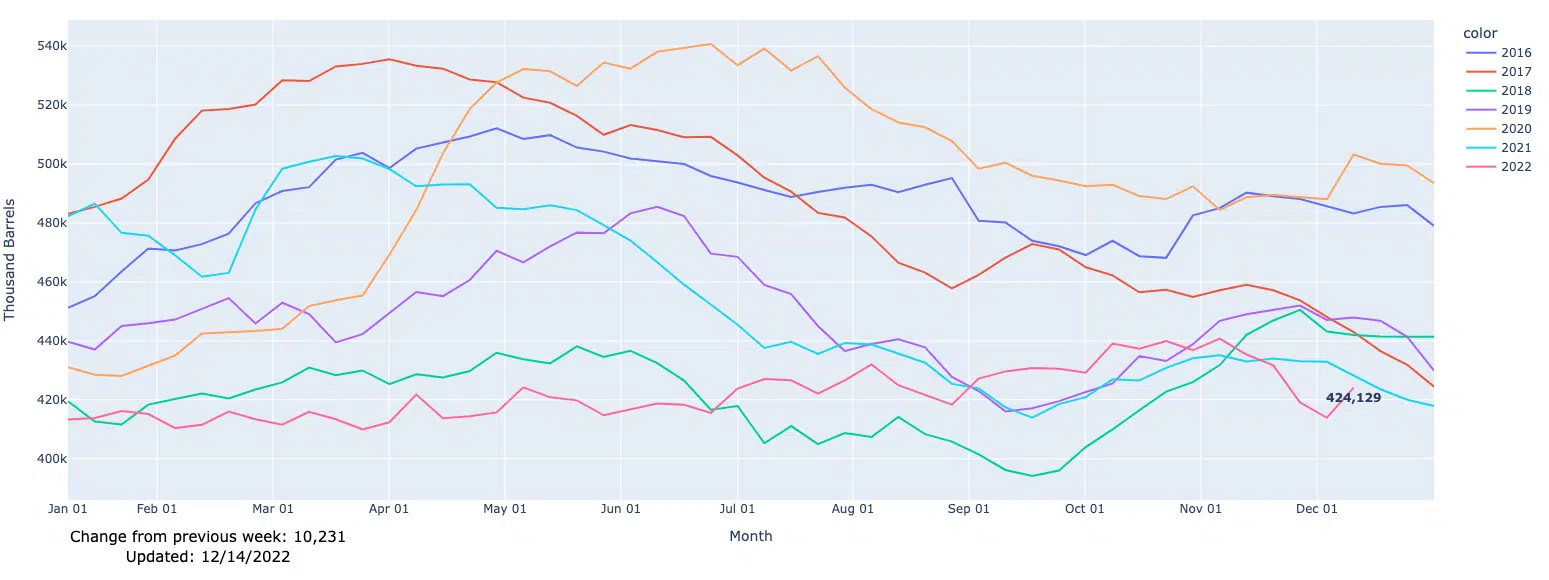
The physical market of crude oil has been a bit of a rebound for inventories of Crude Oil. Last week the EIA weekly status report showed an increase in Crude Oil inventories of 10 million barrels putting pressure on the price.