Gold Breaks Through the 200 Day
Gold breaks through the 200-day moving average for the second time this month. The February contract shows the trading day with good volume. As we have been mentioning in our updates the past few weeks this is likely a very risky place to be getting into a fresh new long position, and certainly not a place you want to be exiting protective options strategy.
I made note again of why,
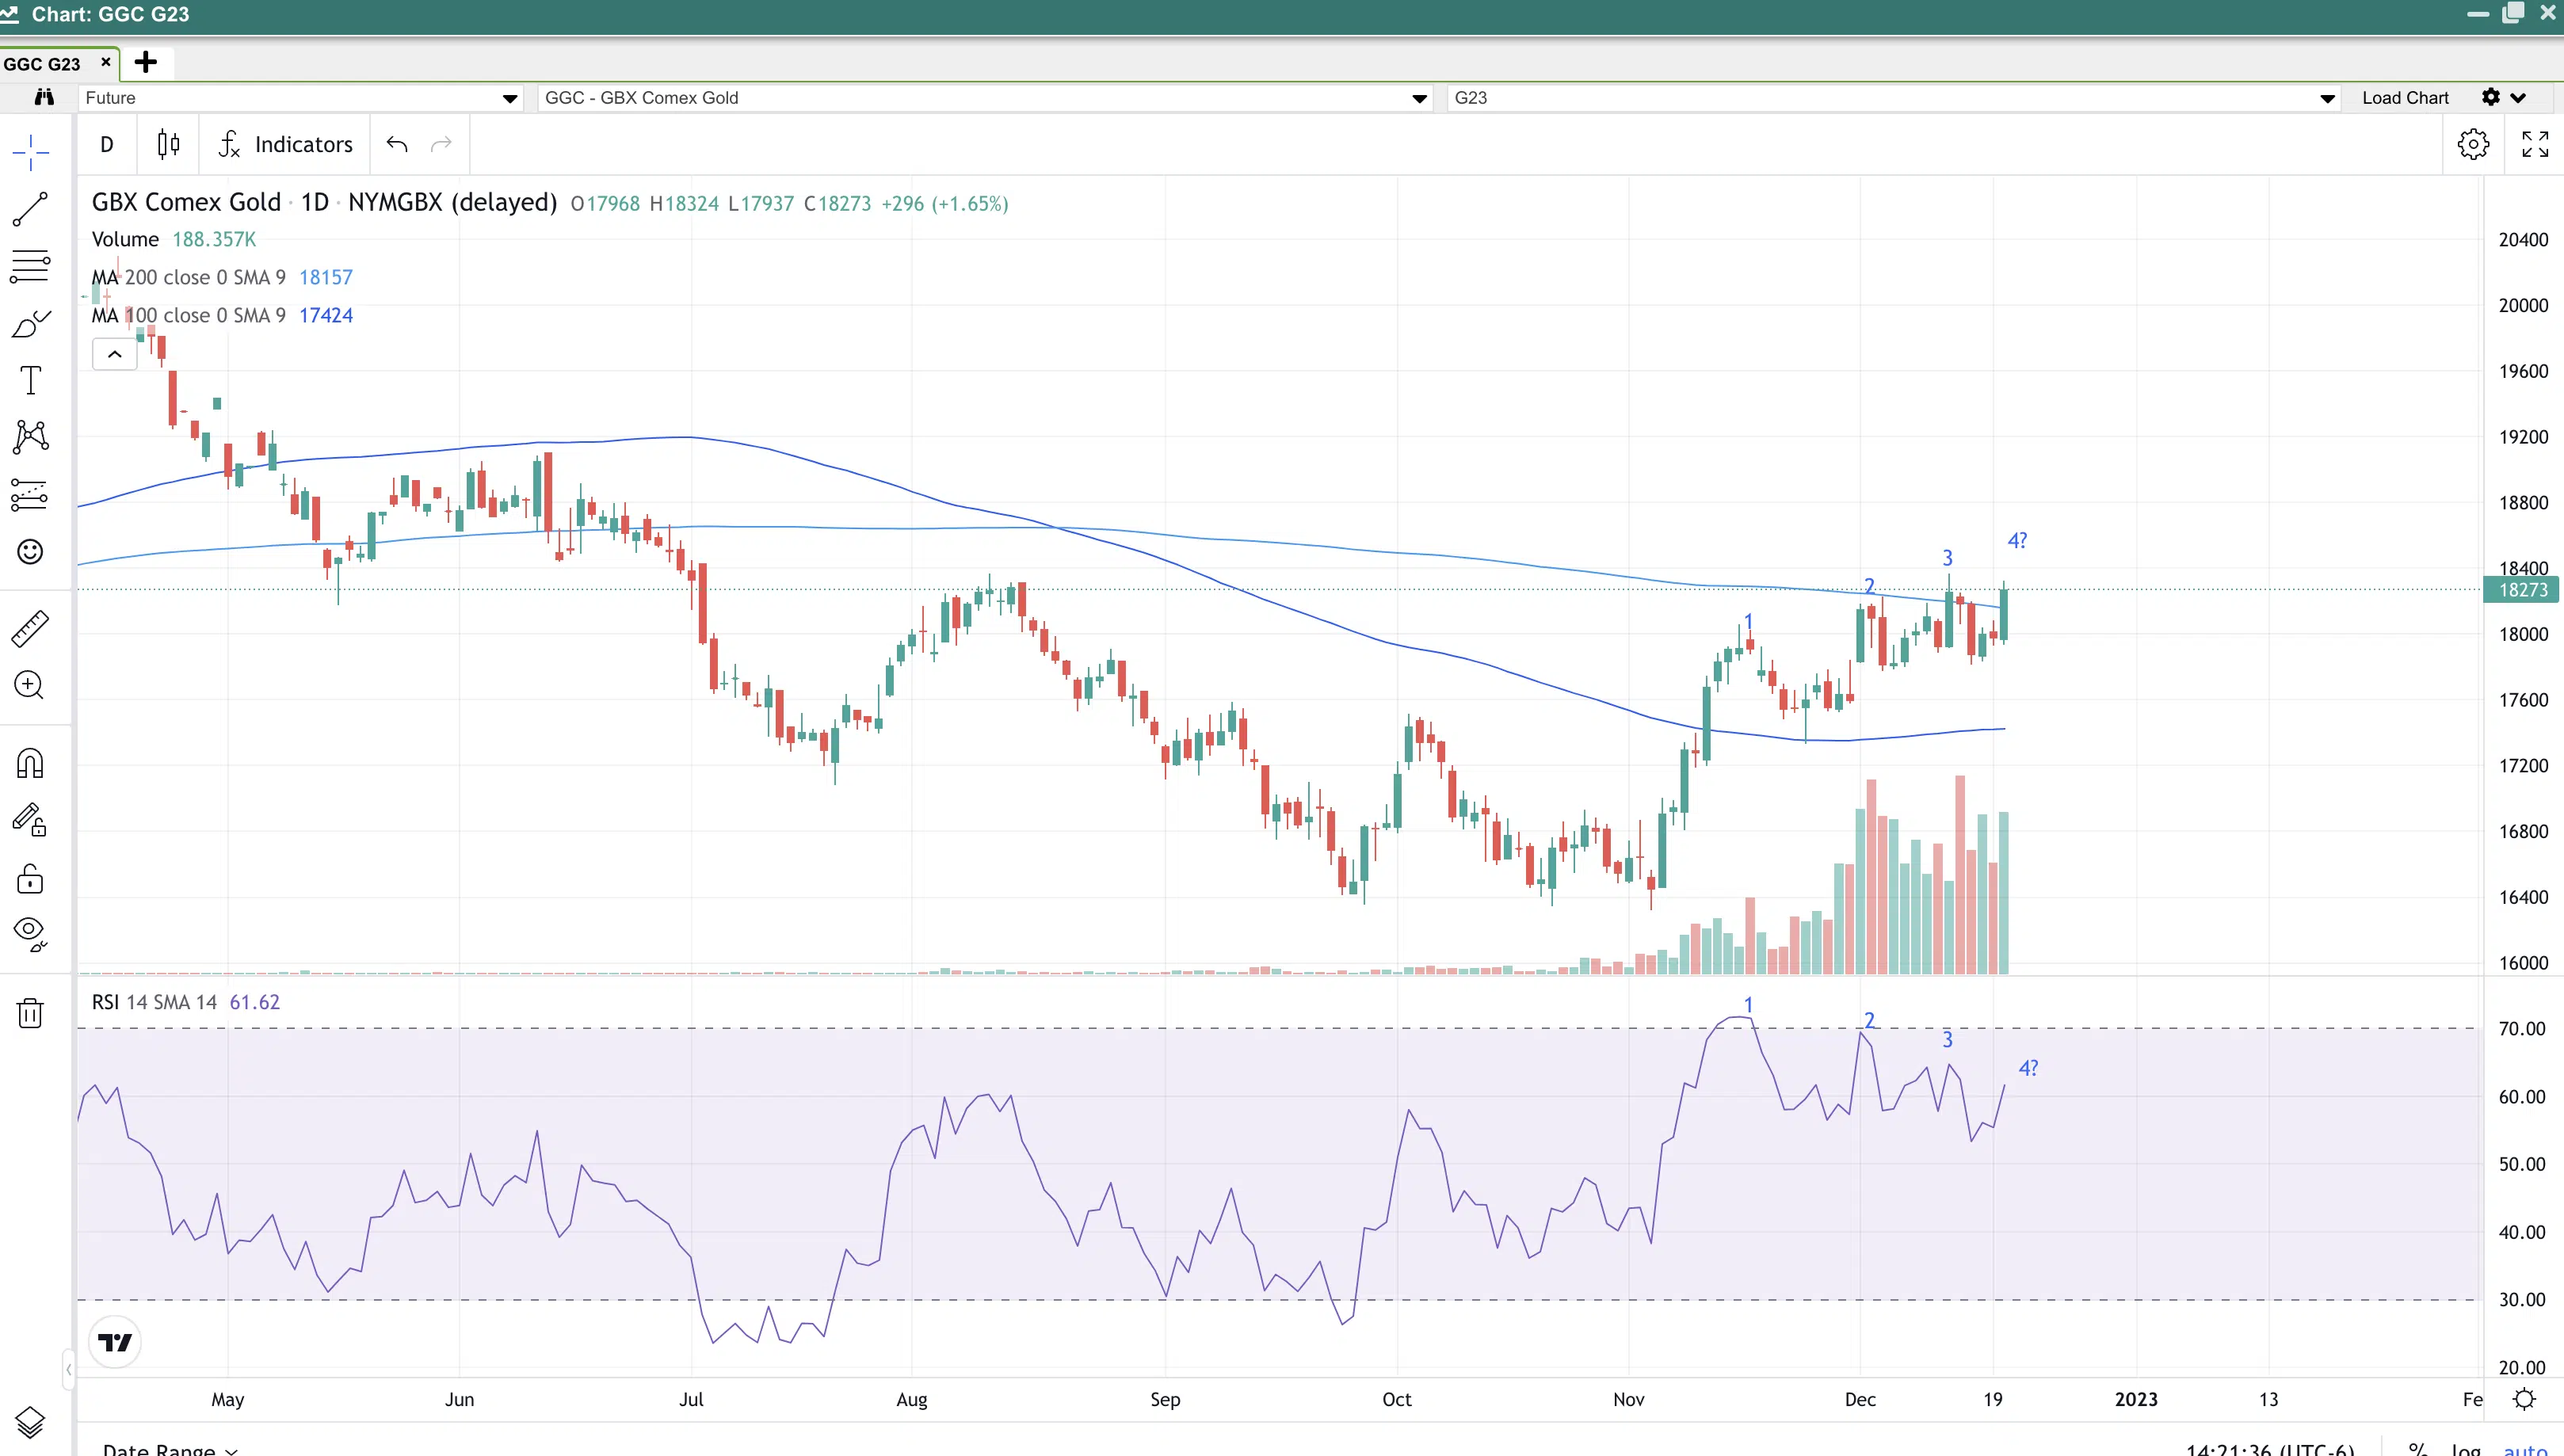
I listed with numbers our new highs on the price chart and correlated the highs with the Relative Strength Index below. Notice that when we get a new high the Relative Strength Index does not confirm. This is a bearish divergence, which is a signal to us to beware, the next item we will look for is a low past a recent day’s low.
If this happens we would consider it a breakdown in momentum, right now you can see the market is putting in higher highs and higher lows. IF the market takes out a recent low, say from last Thursday at 17820, this would confirm a breakdown in Momentum. Support after that might not come until the 100-day moving average at 17424.
Feel free to sign up for our market updates in the top right of our home page, or the trading signal program we offer called Algoreturns.