
John Caruso
Senior Market Strategist
Market Risk:
*(Friday) Core PCE Index reaccelerates to 4.70% yy vs 4.40% previous
*(Friday) Personal Spending +1.8% vs 1.3% exp
*Report: Chinese military artillery close to Russian border being prepped for combat readiness
Week/Week
SP500 -2.50%
NQ -2.82%
RTY -2.86%
10yr Yields +6bps to 3.95%
Oil -0.29%
RBOB -1.97%
Gold -1.61%
Silver -3.94%
Copper -3.97%
We had another week of growth slowing/inflation accelerating data points last week with Friday’s PCE Index accelerating on both a m/m and y/y basis. Of course this was a follow up to the prior week’s reading of “hotter” CPI and PPI data – markets responded in kind with the broader indices finishing lower. So here the trouble, in January the SP500 gained 6.5%, and the NASDAQ +16% – this usher’s in the obvious, you can’t have higher stock valuations and a “risk-on” mood for markets without seeing inflation creep back into the picture. And that’s exactly what we’ve seen. The Fed hawks were back out in full force at the end of last week with Bullard and Mester talking “higher for longer” on interest rate policy. The CME Fed Watch is now pricing in 5.50% as its base case for the Fed terminal rate, and 5.75% is gaining ground! I was also reading last week that the US Treasury paid out $800B in interest payments in 2022 (this is certainly headed for the Trillions). And now the US Treasury is now borrowing from the Fed at 5% – with all of that being rolling debt, this is how debt levels can go “parabolic” from here. Have a look:
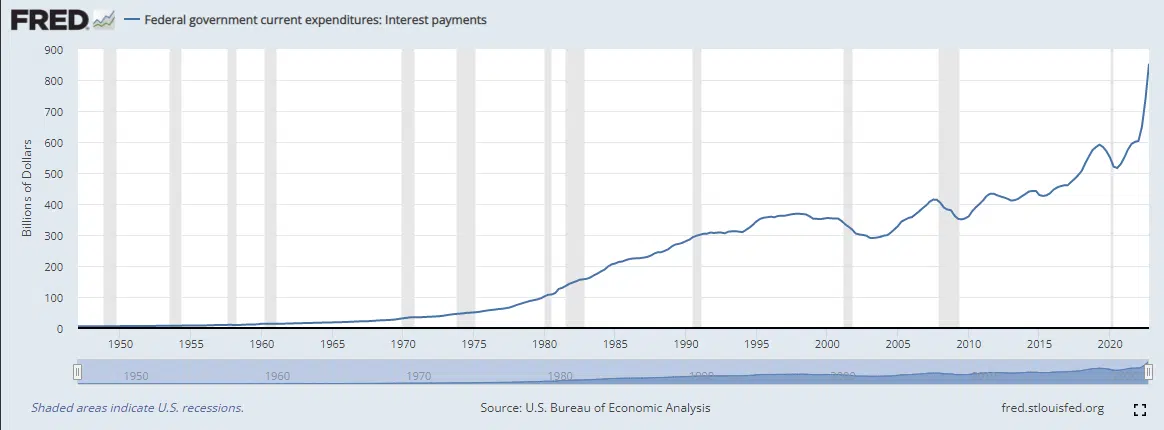
$800B is now approximately 20% of the US spending budget!
So what’s the solution here? That’s obvious … LOWER INTEREST RATES. But how? The Fed cannot lower interest rates without reintroducing inflation back into the mix – so that’s off the table for now (we should hope at least). What other choice does the Fed have? They can attempt to create a credit event in markets, and higher levels of unemployment, all in the name of getting asset valuations and inflation DOWN and to stay DOWN in order for them to begin lowering interest rates again. Excuse the flippant nature of that, but I think that’s stating the facts and the obvious the best way I can. And if I’m wrong, and the Fed does pivot TOO SOON, then fine – We all know how to make money in that environment – but in my personal opinion, that would be disastrous for the long run!
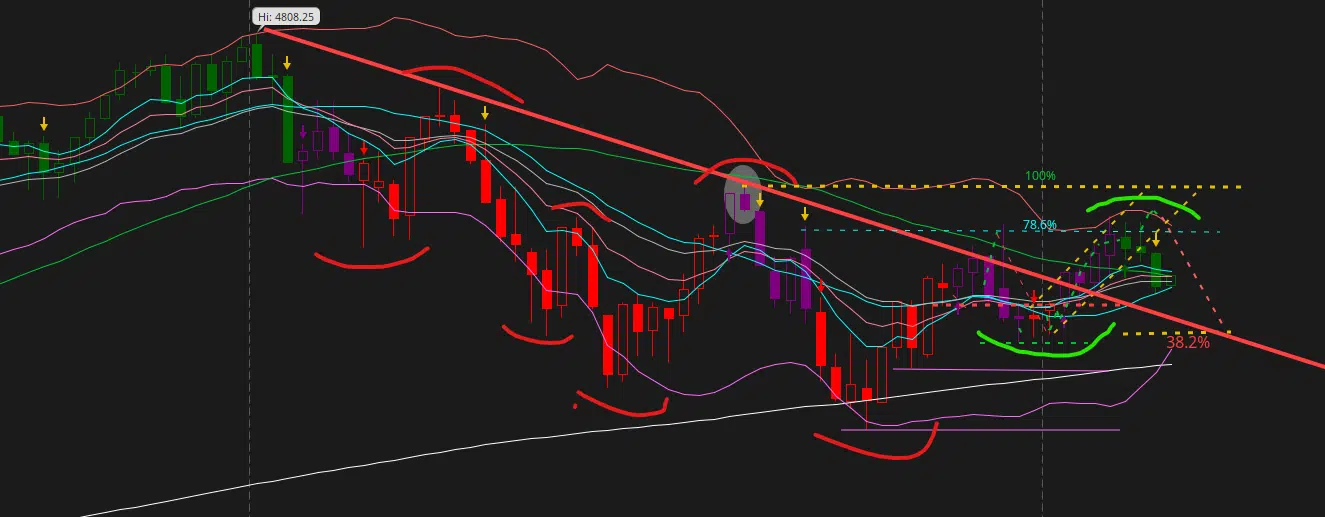
Now on that note, my technical analysis of the market isn’t nearly as bearish as my fundamental outlook! My current technical view at the moment only has the SP500 retesting YTD opening prices down in the low 3800’s. At the moment, the weekly and monthly charts are positively configured with higher lows and higher highs – which certainly doesn’t sink up with my doom and gloom, aka the Fed “has no choice” but to tank the economy here to rid us of inflation viewpoint. Below is a look at the weekly configuration of the SP500 that is now showing a change of the trend of “lower highs and lower lows” to now seeing a slight change over the last 3 months to “higher lows and “higher highs”.
SP500 Weekly Chart
While I still have Fed/Mar/Apr pegged as a “risk off” period for markets, I’m still of the view (for now) that this will also bring a pretty good long side opportunity when we come out of this period. This is what I’m seeing at the moment, and will remain agnostic – if these conditions change, so will I.
*VIX: we can see some run-off in vol over the very near-term, but theirs a regime change that took place last week and we’re now in a “rising period” for volatility
| Market | Trend > 6 mo | Range Low | Range High | Momentum | OB/OS |
| SP500 | Bearish | 3971 | 4086 | Negative | 51 |
| Nasdaq 100 | Bearish | 11,917 | 12,444 | Neutral | 46 |
| Russell 2000 | Bearish | 1875 | 1939 | Neutral | 62 |
| 10yr Yield | Bullish | 3.67% | 4.04% | Positive | 28 |
| VIX | Bullish | 20.01 | 22.71 | Positive | 39 |
| Oil | Bearish | 73.46 | 77.15 | Negative | 60 |
| Gold | Bullish | 1792 | 1875 | Negative | 53 |