Grain Market Review
The market has lacked fresh news since the February WASDE. Corn and soybeans continue to annoy the trade with the market respecting the uptrend line we’ve had since our summer lows.
I expect volatility to pick up again in March. Multiple events will bring excitement to the grain markets, including:
- March 8th Crop Production and USDA Supply/Demand Reports
- March 19th is when the “Safe Passage” grain deal comes due between Ukraine and Russia.
- March 31st Grain Stocks and Prospective Plants Reports.
Overall it has been disappointing not having the weekly COT reports to help build our narrative. The last COT report we had showed Corn being relatively bullish, IMO. Still, no word this week if we will see one, but it looks unlikely.
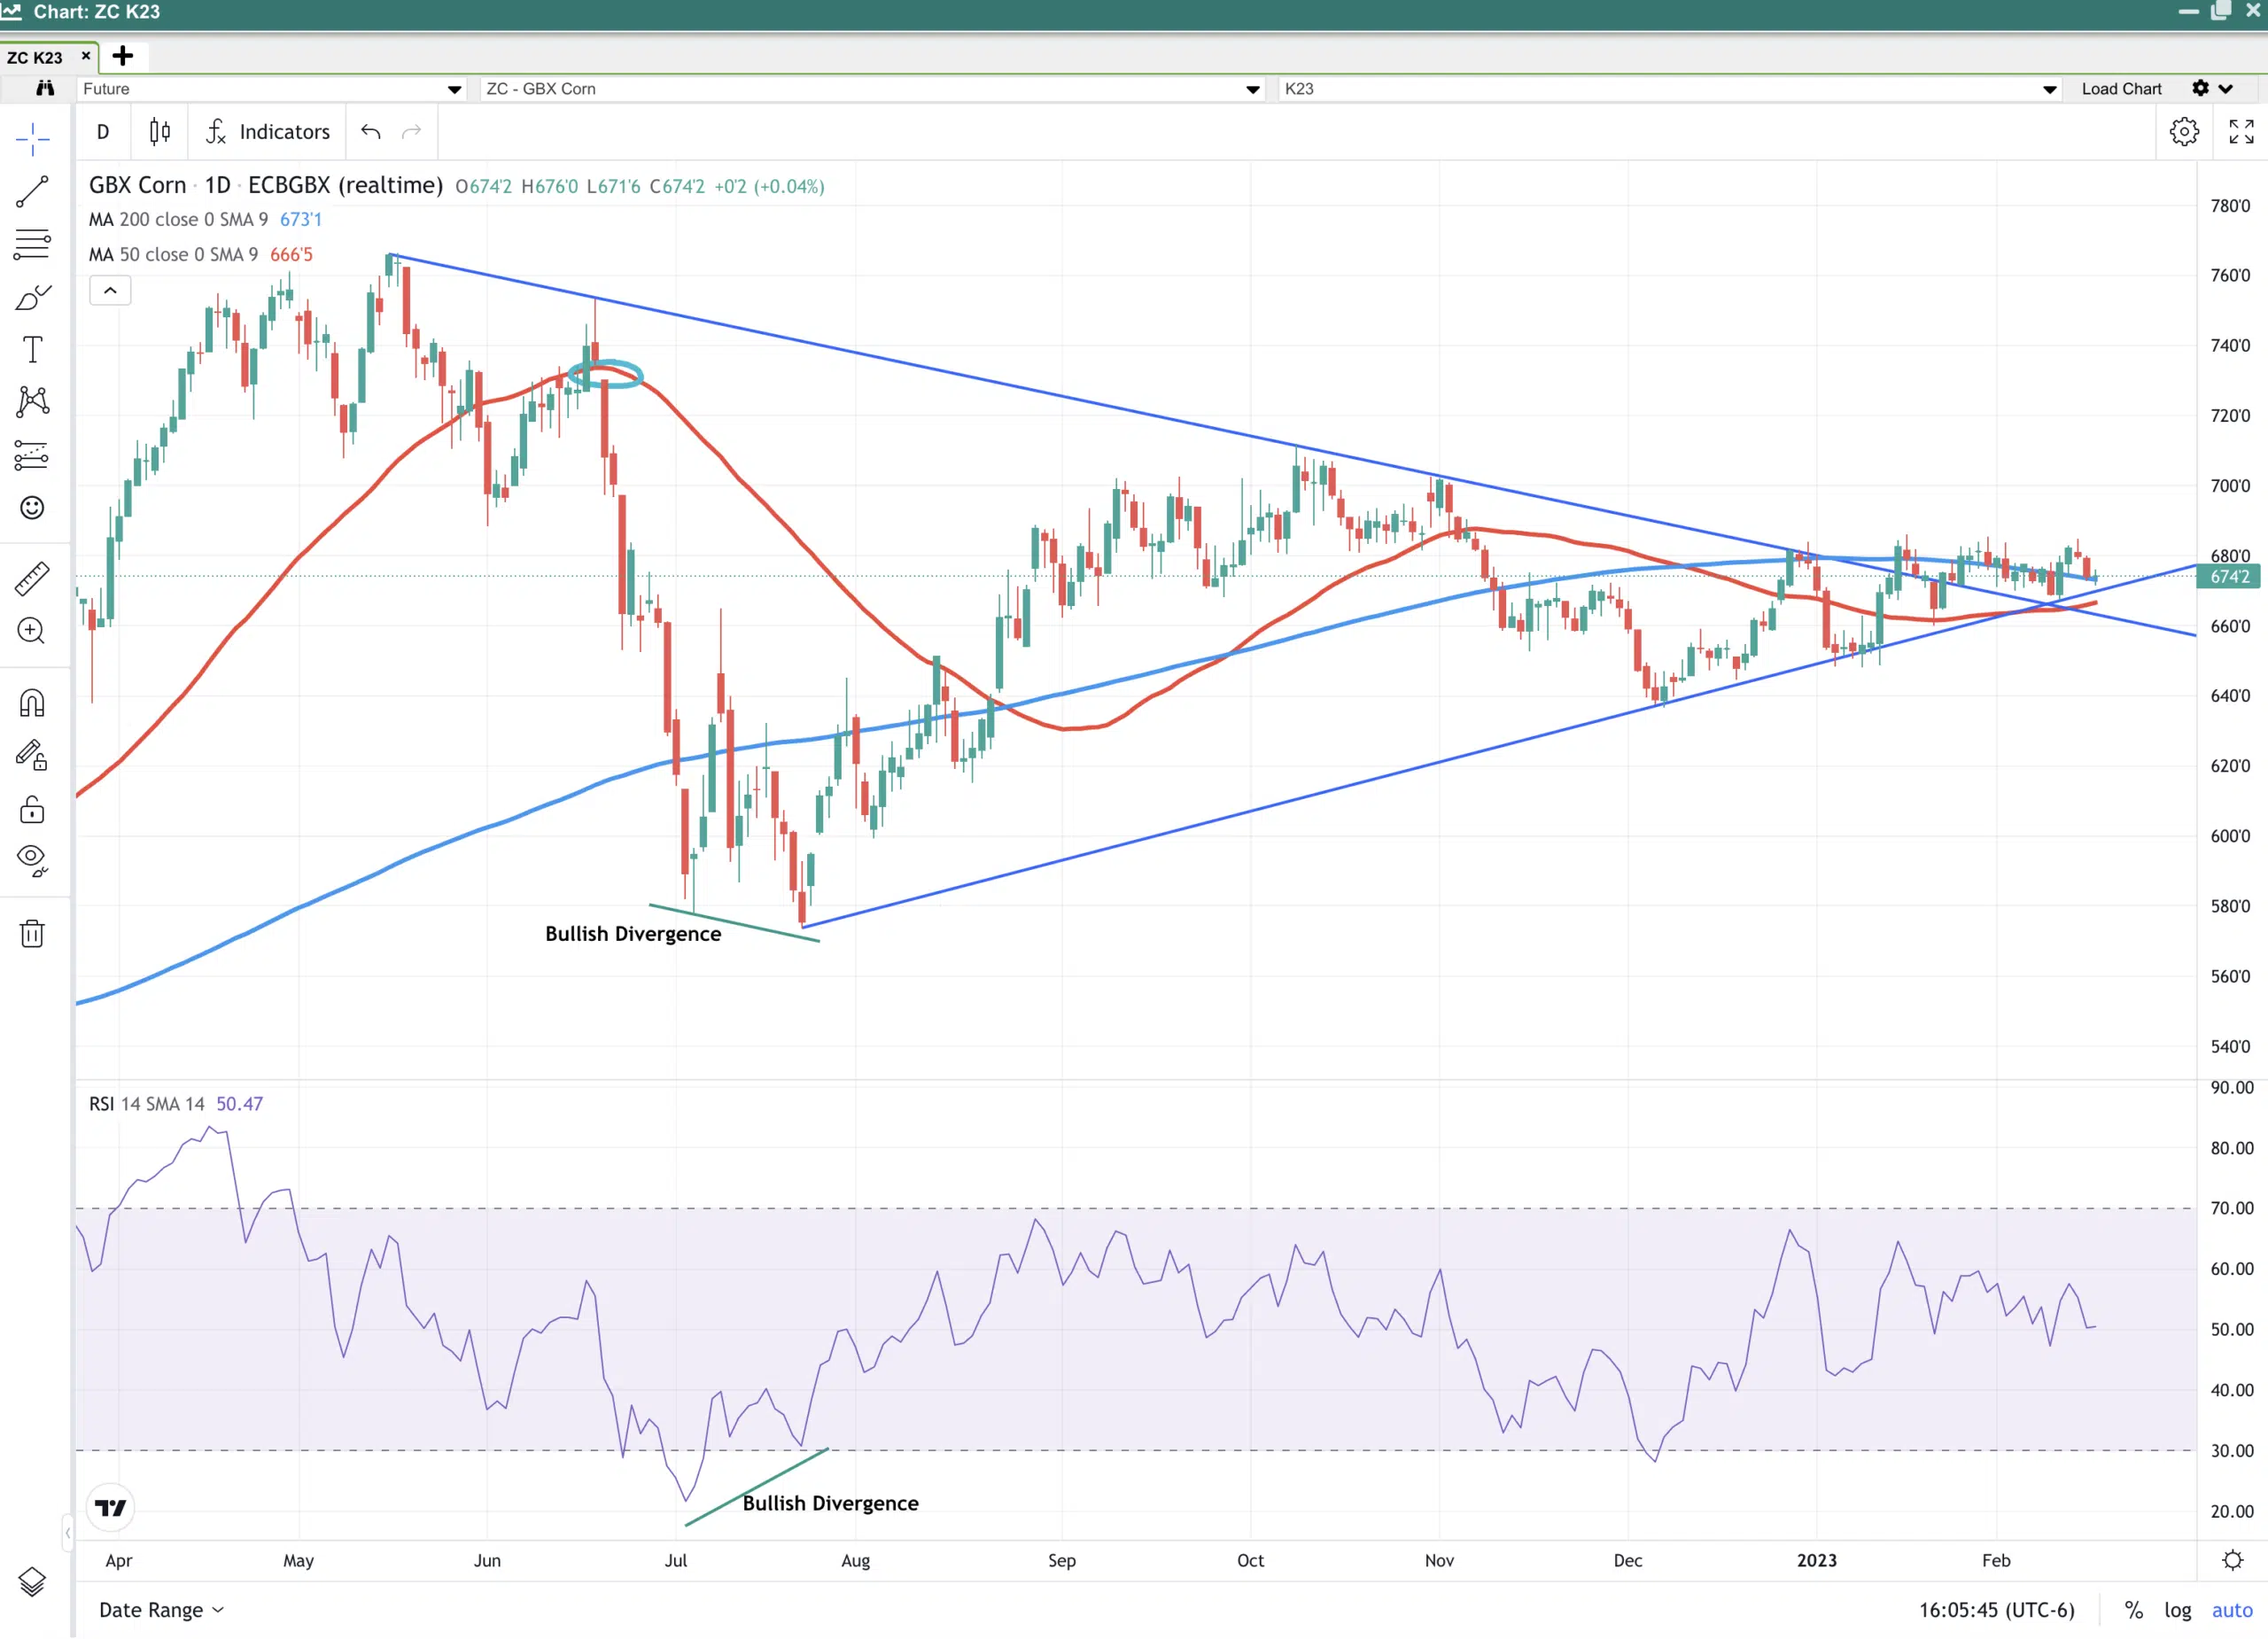
Corn Price Chart:
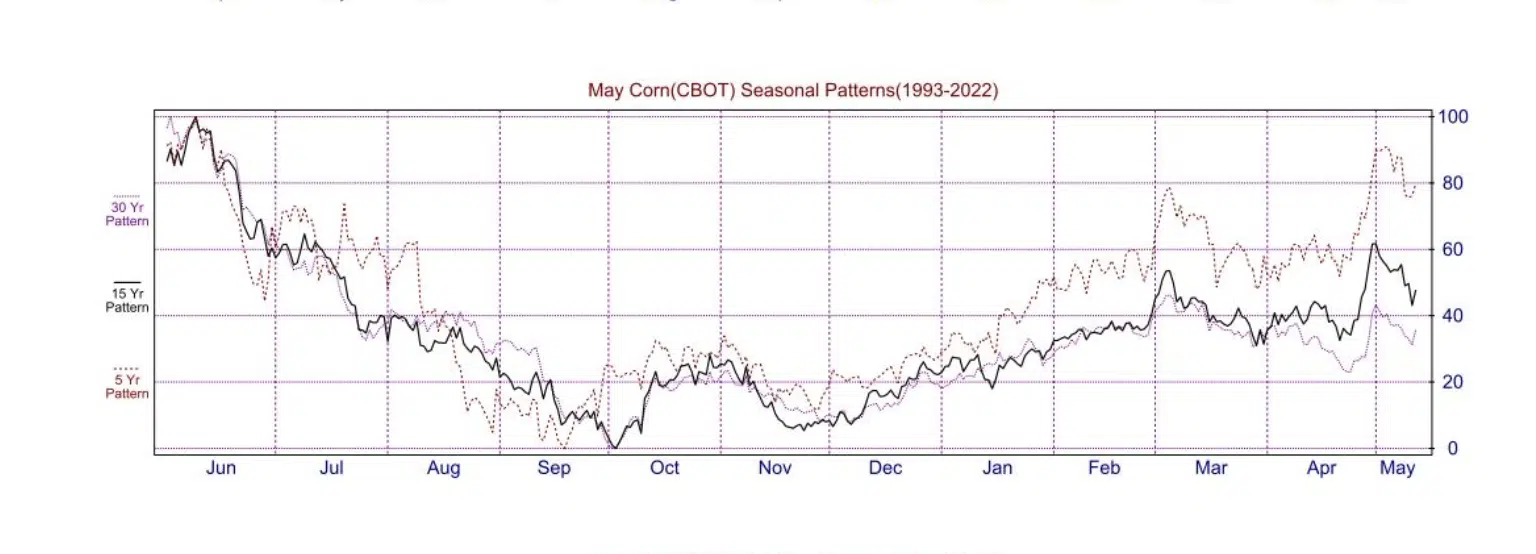
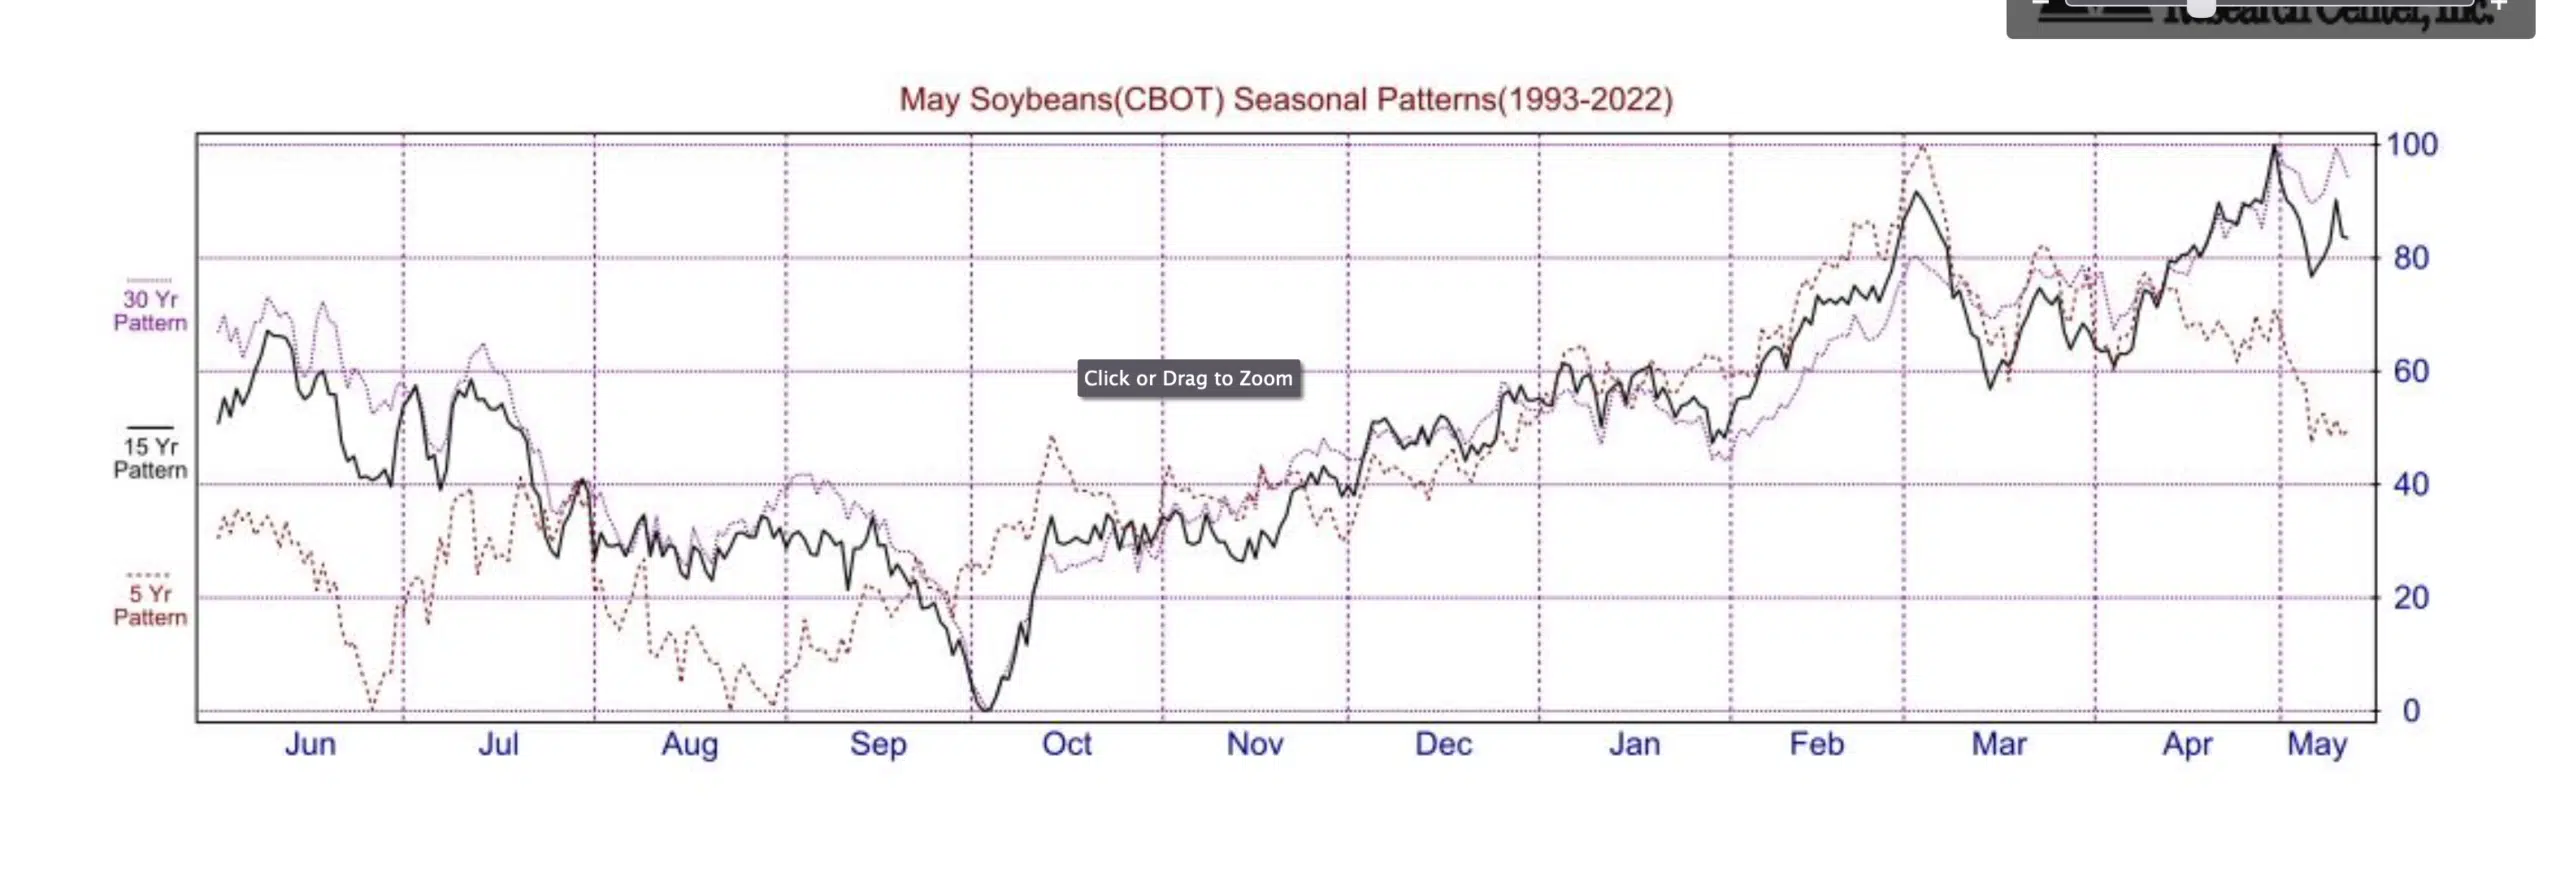
Corn respects the uptrend line that starts from our summertime low. The reverse seasonal was challenging to deal with this year. One indicator that kept us from selling the lows was the bullish divergence we saw as the chart pushed to new lows. Notice how the daily sticks made new lows, but the RSI indicator did not confirm. This signaled a weakening bear trend. Fast forward to today’s market, the RSI doesn’t serve us many purposes on the daily chart. I just wanted to illustrate this as a learning point.
Today’s chart is still telling me that it is ok to be long corn still. Our lows continue to get higher each time we get pushed down. We also have the 50-day moving average starting to point higher again. This will be something I watch as it approaches the 200-day moving average. If the 50-day gets back above the 200-day, this should increase speculative buying.
The 7.30 gap is still in play, and with seasonal still on our side, I have to lean on the side that this gets filled. We will continue to keep our eye on this trend line. A hard close below the trend line will start to make things more complicated, and we may need to mitigate some risk on the long side.
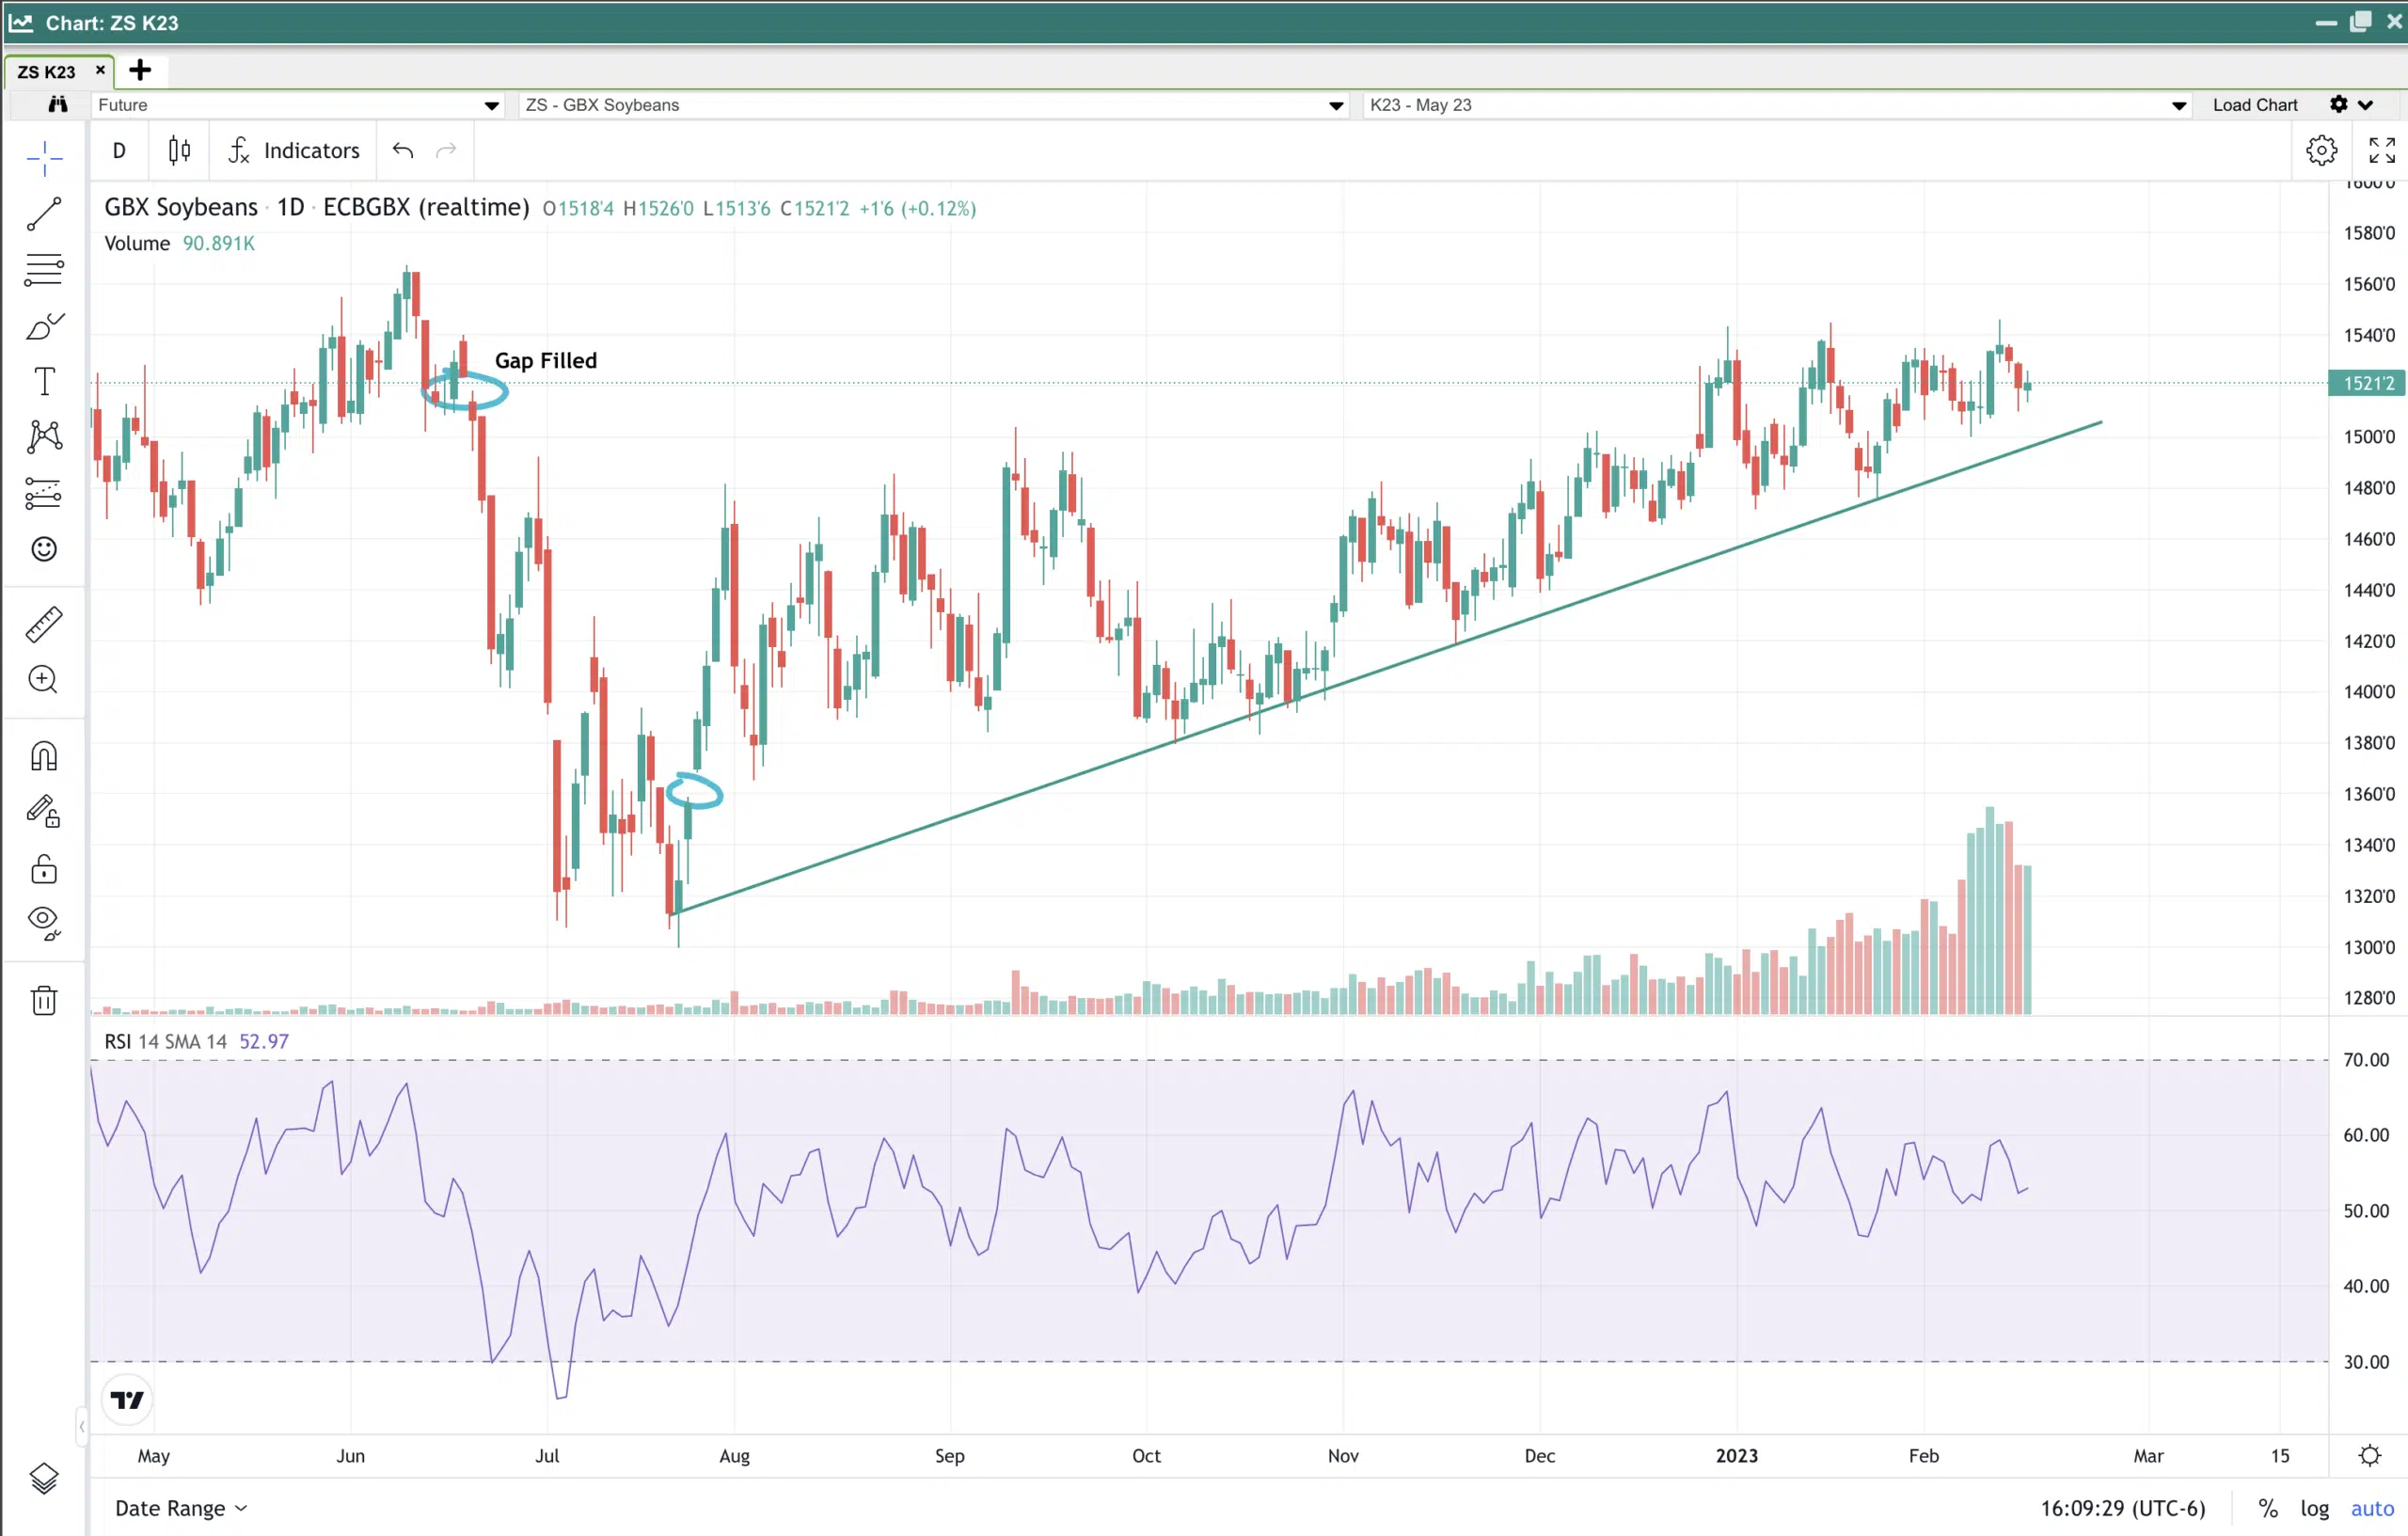
Soybean Price Chart:
Soybeans also continue to respect the trend line that dates back to this past summer’s lows. I have never seen more people in the trade trying to pick a top in a market. The soybean and soybean meal markets have made many people playing the short side lose a considerable amount of money in the past two months. Today AgRual lowered their est for the Brazilian 2 million metric tons to 150.9 million metric tons.
Northern Brazil remains too wet, and southern Brazil is getting clipped by the drought that has consumed Argentina. February is a critical month for northern Brazil. They are harvesting their soybeans and planting their second crop of corn right behind the harvesters. They need to plant corn in February to avoid extreme heat during pollination. Planting progress can be followed in your RJO platforms in the “market insights” tab.
I can’t help but think about what our soybean market will look like one year after the introduction of renewable fuel demand. There are planned builds for around 400 million bu of added demand of oilseeds in the U.S. due to the added crush capacity. By this time next year, we could start to see the demand take hold as the crush facilities begin to get a forward book on to start processing in Q4 of 24 and Q1 of 25. With today’s carryout of 225 million bushels, the U.S. will likely be importing soybeans and requiring more acres.
We will still need to be cautious of market breakdown between now and then. Fund length is exceptionally long in the meal market; this adds risk to the bean complex if the support trend line has a hard break, and the likelihood of filling the gap at 13.60 increases significantly.
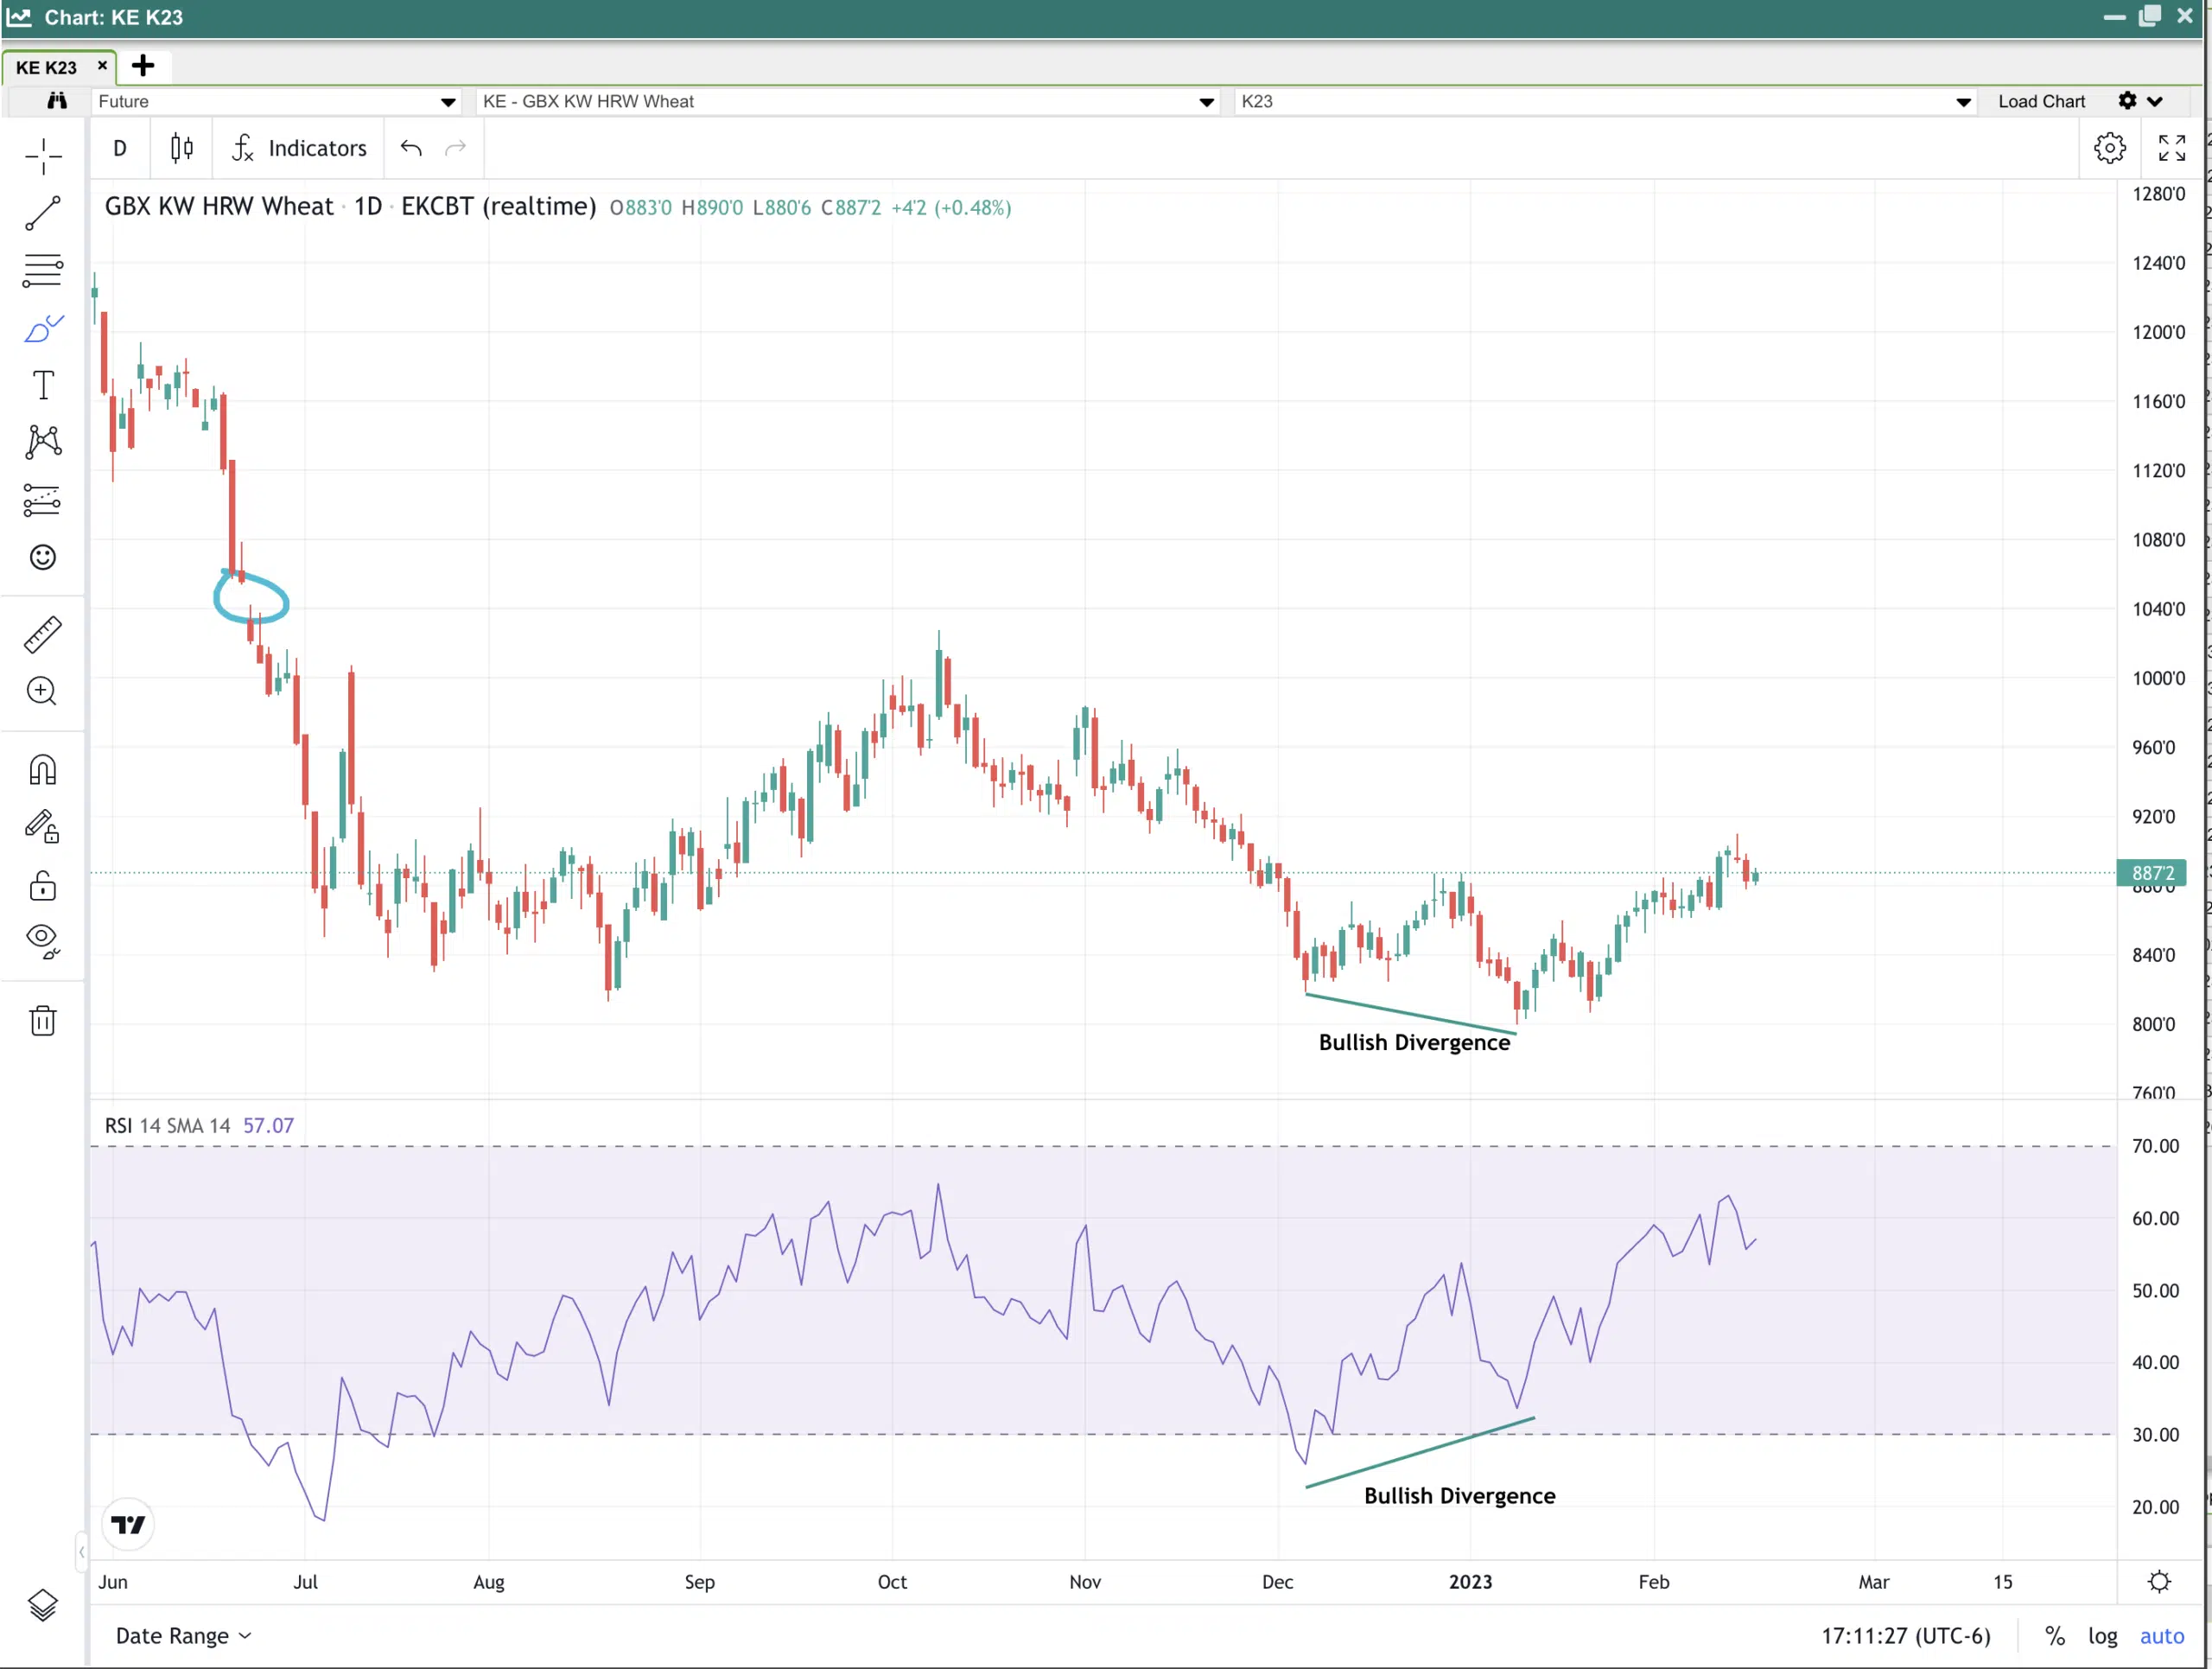
Wheat Price Chart:
Wheat has a similar bullish divergence going on that corn did this summer. It would be a good enough signal to the shorts to suggest an exit. Fund length in wheat was significant the last time we saw the COT report. KC broke multi-month highs this week, followed by some profit taking.
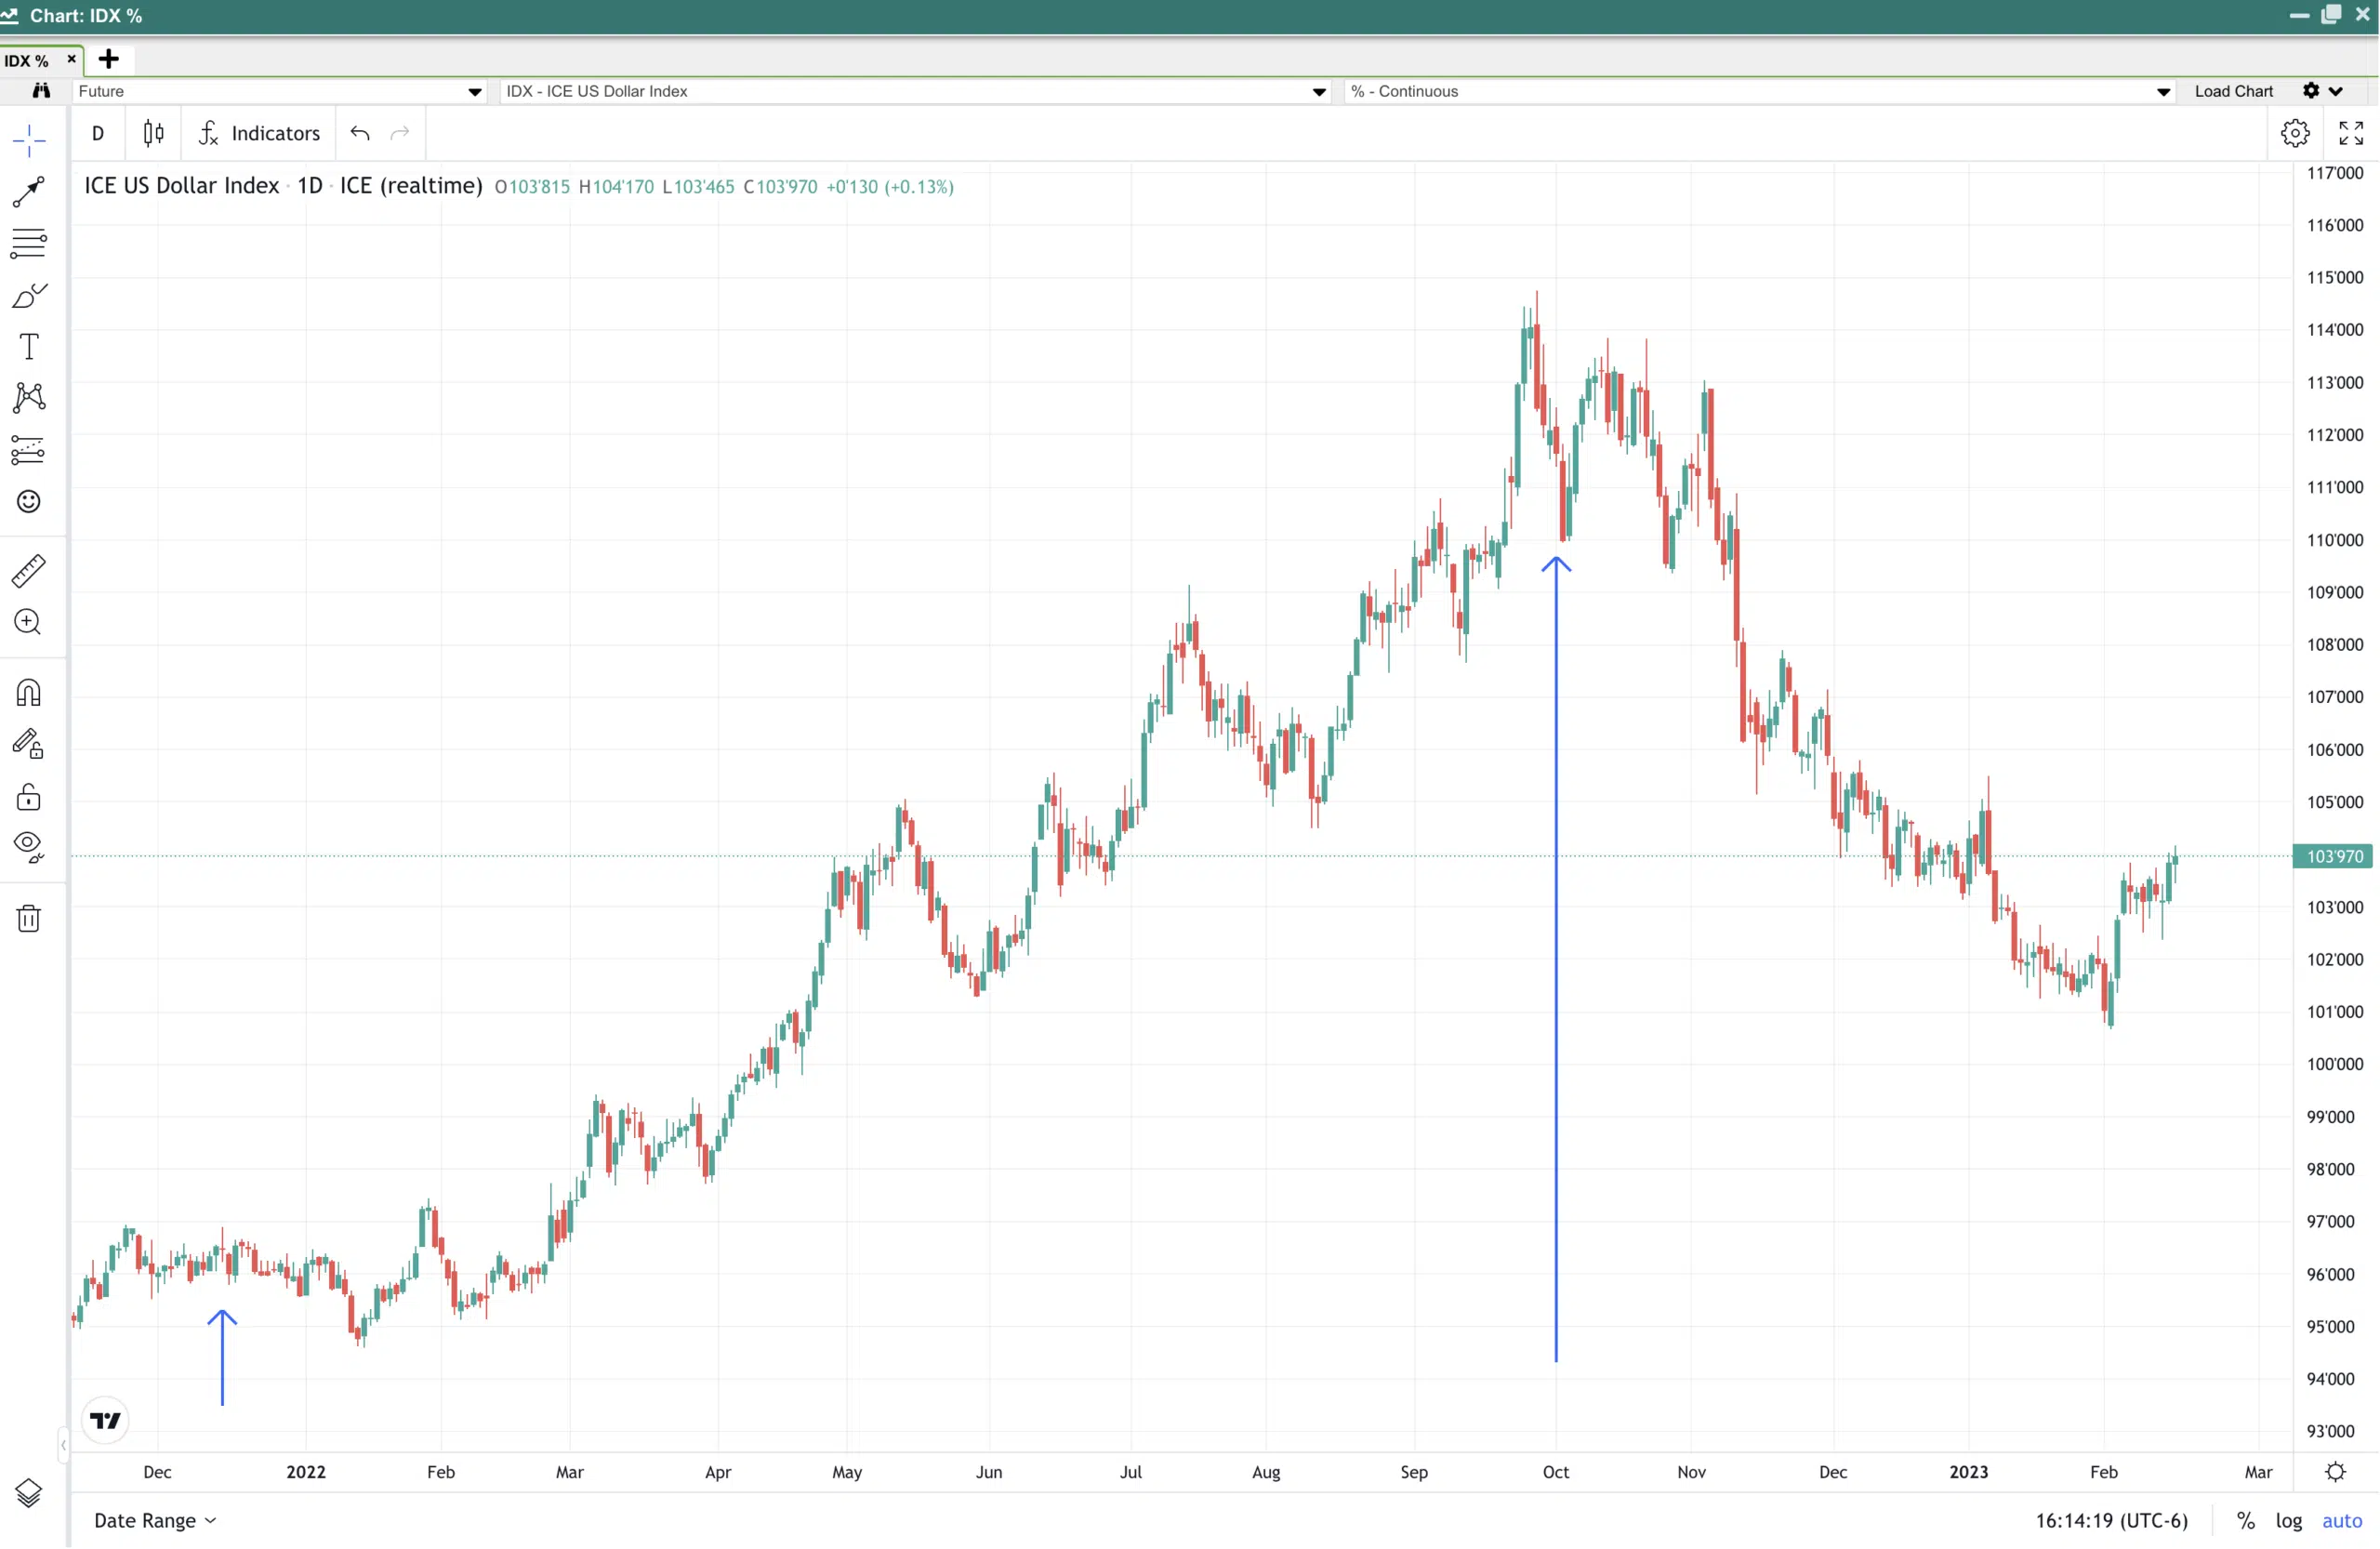
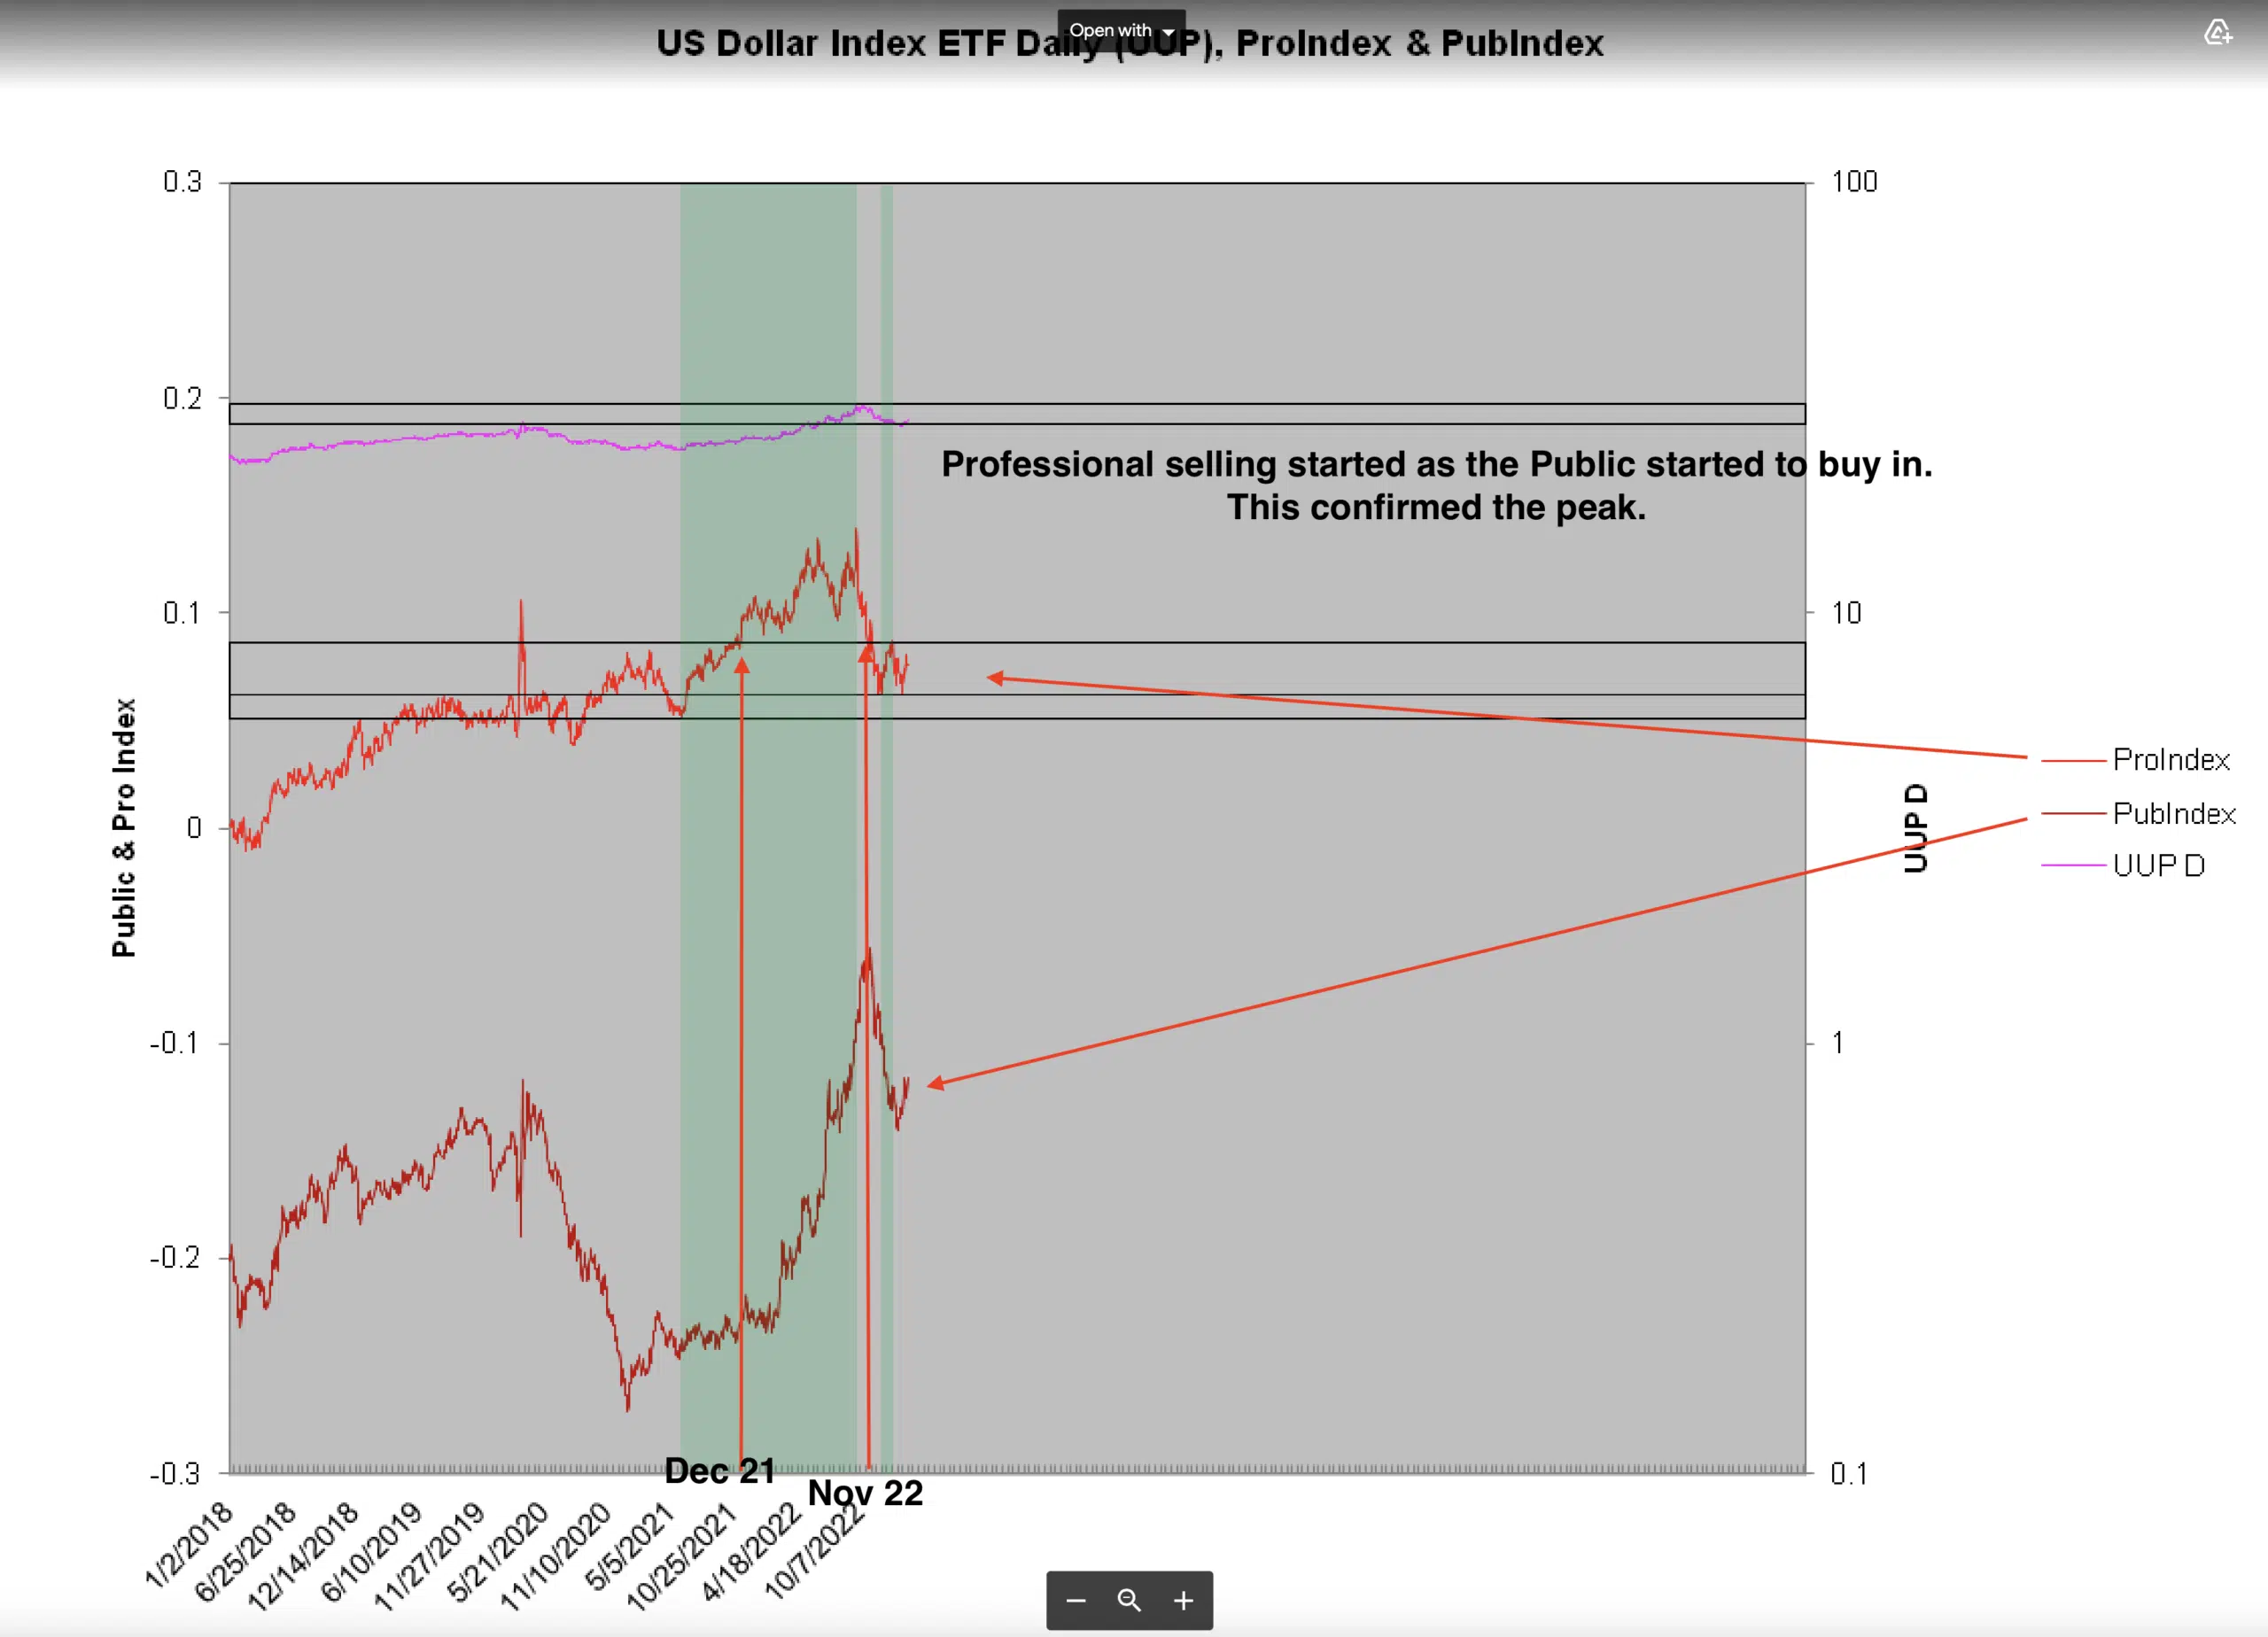
U.S. Dollar Index Chart:
2022 was the year of the rising dollar. This kept many of our commodity markets in check. A higher dollar is not good for Crude Oil prices, gold, and for exporting grains. So far, 2023 has been the year of the declining dollar. This has been supportive of the grain markets and has helped keep a floor on Crude Oil prices. One of the ways we track dollar movements is through the Pro Index. Some of you recall December 2021 emails for a Higher dollar. The ProIndex helped us with that call. There were also emails sent out about a warning of a declining dollar on November 22. This was also made by utilizing the ProIndex. We will continue to watch the Proindex for all the markets we track, but it seems to do particularly well with the dollar market. I subscribe to Eric De Groot’s website to follow the ProIndex. He has many tools that help us navigate the markets. Check him out by clicking on the ProIndex Chart shown below