Corn:
Corn trade on Tuesday was extremely frustrating to watch. The total gain from last Thursday’s post report rally was lost and it appeared the down trend was going to continue. The market seems to inflict the most amount of pain. Running through the sell stops that were put in place for anyone that bought on report day seemed to be just that…Pain. The amount of bearishness that has crept back into the news wires is about as bad as I’ve seen it, but I’m sorry I’m just not in that camp at this point.
Take a look back at the first few days of March, we made a spike low and ended the month higher, many times our lows come in the first or second trading day of the month. This is not 100% but it can be the case, and one that I believe might be the case we are in now.
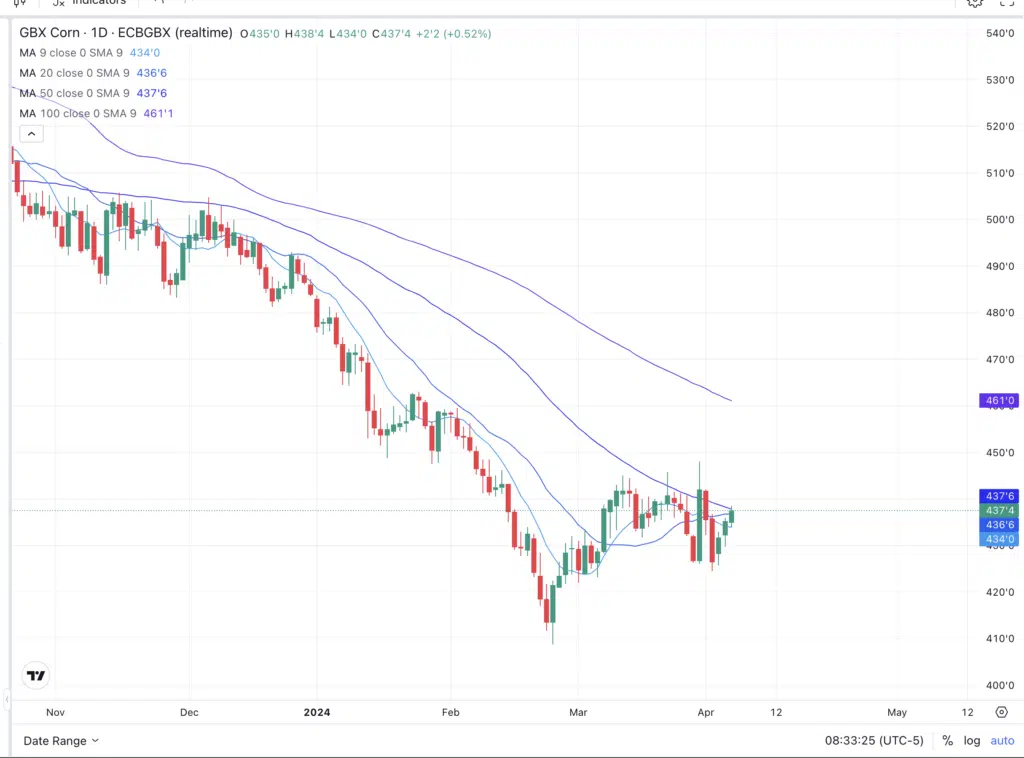
Corn price action today was completely inside of yesterday’s price range. Creating an “inside day” We like inside days to help set risk parameters for traders that are looking to enter any given market. Below is a daily corn chart with 9,20,50, and 100 day moving averages. You can see the most recent big red bar was Tuesday’s trade and you can see how it ran through Thursday’s trade. Today’s trade is the next green bar and as I type this we are in night session so this Thursday’s trade has a new bar. We are still trading inside of Tuesdays trading range.
Notice we have a cluster of moving averages consolidating around the 4.34-4.3825 range. If we can get continued strength in wheat and corn it won’t take much to get the price above 9,20,and the 50 day moving average. Once we get prices above the moving averages and the 9 day above the 20 and 50. We should see the fund start to liquidate their short position.
If we can get some closing price action above 4.40 it will be very hard for me not to call a short term bottom. At this point it is still a larger risk that we make another push closer to the 4.22 low, but I do not favor that.
Soybeans:
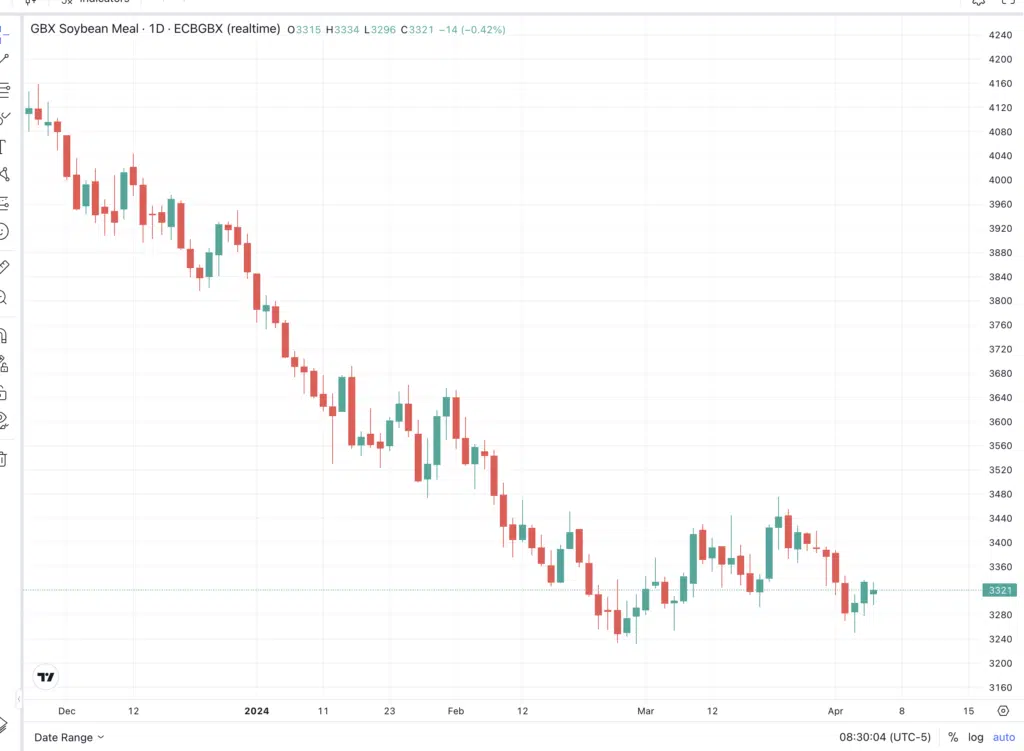
Soybeans still have a very nice looking chart. So far things are going according to plan and we are seeing a nice pull back into the 62% retracement. We didn’t quite get there today but it seems the soymeal market is rejecting the lower price of 330/ton, and soy oil really doesn’t have a reason to be weak when energy prices have had such a solid run and palm oil continues its march higher. Leave room open to the downside at 11.66. Could we just go higher from here? Sure, but we will need to see beans break the 12.26 high in order to confirm the correction is done and once this takes place we can begin to make some predictions on what our next targets will be.

Silver, Crude charts:
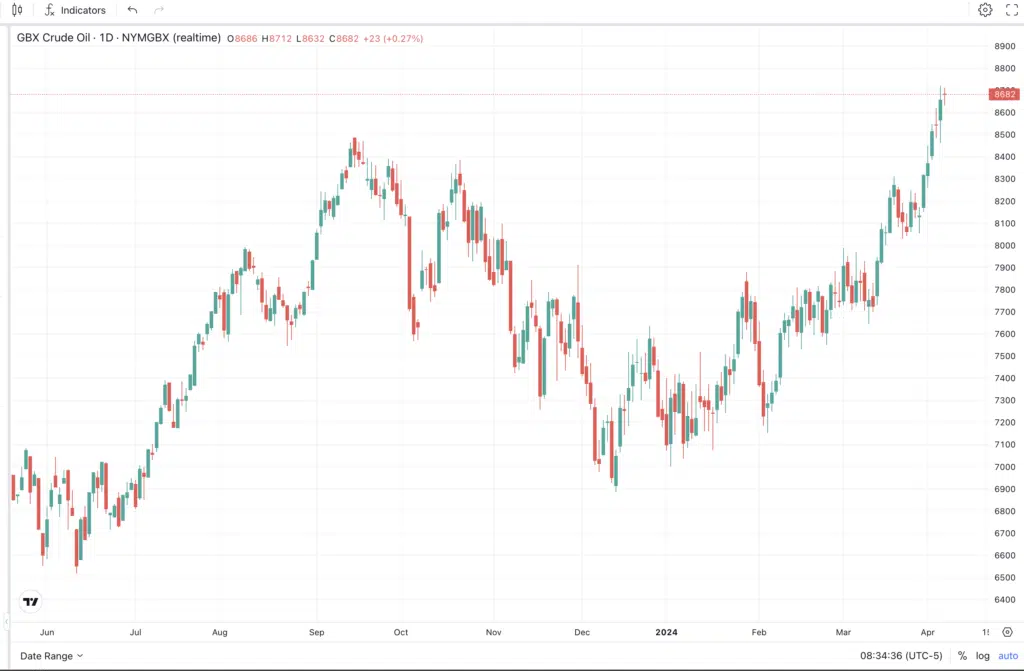
Commodities as a whole seem to be gaining strength. Many markets are breaking out past their highs in 2023 Coffee, Silver, Cotton, Hogs, energies. Metals are on fire also. In 2020 we had silver being one of the leading markets when this entire inflation trade started. Now silver is making another move higher. It just really seems odd that almost all the commodity markets are catching a bull run but grains are still lagging behind. Most of the markets that are moving higher also came down in 2022 before the grain markets did. So that can be a part of what’s happening with the lagging of the grain market.
One more thing I’d like to mention on the crude oil is that we are seeing continued strength in the Crack spreads and the time spreads. This is a health bull market in the energy sector and it shows there is strong consumer demand. We send out the Michigan consumer sentiment once a month when it comes out. This is a good tool for addressing meat demand and gasoline demand.
It also means that grains are a great value compared to other commodities. It would be very strange if we were to get another leg lower in the grain markets at this time of year and with the funds this short.

Contact Us
Paradigm Futures commodity brokers are here to help you trade gold futures contracts. Our specialty is guiding investors in commodity markets they are interested in. When it comes to gold futures, we are ready to help you. Contact us today to get started.
This material has been prepared by a sales or trading employee or agent of Paradigm Futures, and is, or is in the nature of, a solicitation. This material is not a research report prepared by Paradigm Futures. By accepting this communication, you agree that you are an experienced user of the futures markets, capable of making independent trading decisions, and agree that you are not, and will not, rely solely on this communication in making trading decisions.
DISTRIBUTION IN SOME JURISDICTIONS MAY BE PROHIBITED OR RESTRICTED BY LAW. PERSONS IN POSSESSION OF THIS COMMUNICATION INDIRECTLY SHOULD INFORM THEMSELVES ABOUT AND OBSERVE ANY SUCH PROHIBITION OR RESTRICTIONS. TO THE EXTENT THAT YOU HAVE RECEIVED THIS COMMUNICATION INDIRECTLY AND SOLICITATIONS ARE PROHIBITED IN YOUR JURISDICTION WITHOUT REGISTRATION, THE MARKET COMMENTARY IN THIS COMMUNICATION SHOULD NOT BE CONSIDERED A SOLICITATION.
The risk of loss in trading futures and/or options is substantial and each investor and/or trader must consider whether this is a suitable investment. Past performance, whether actual or indicated by simulated historical tests of strategies, is not indicative of future results. Trading advice is based on information taken from trades and statistical services and other sources that (Insert IB Name) believes are reliable. We do not guarantee that such information is accurate or complete and it should not be relied upon as such. Trading advice reflects our good faith judgment at a specific time and is subject to change without notice. There is no guarantee that the advice we give will result in profitable trades.