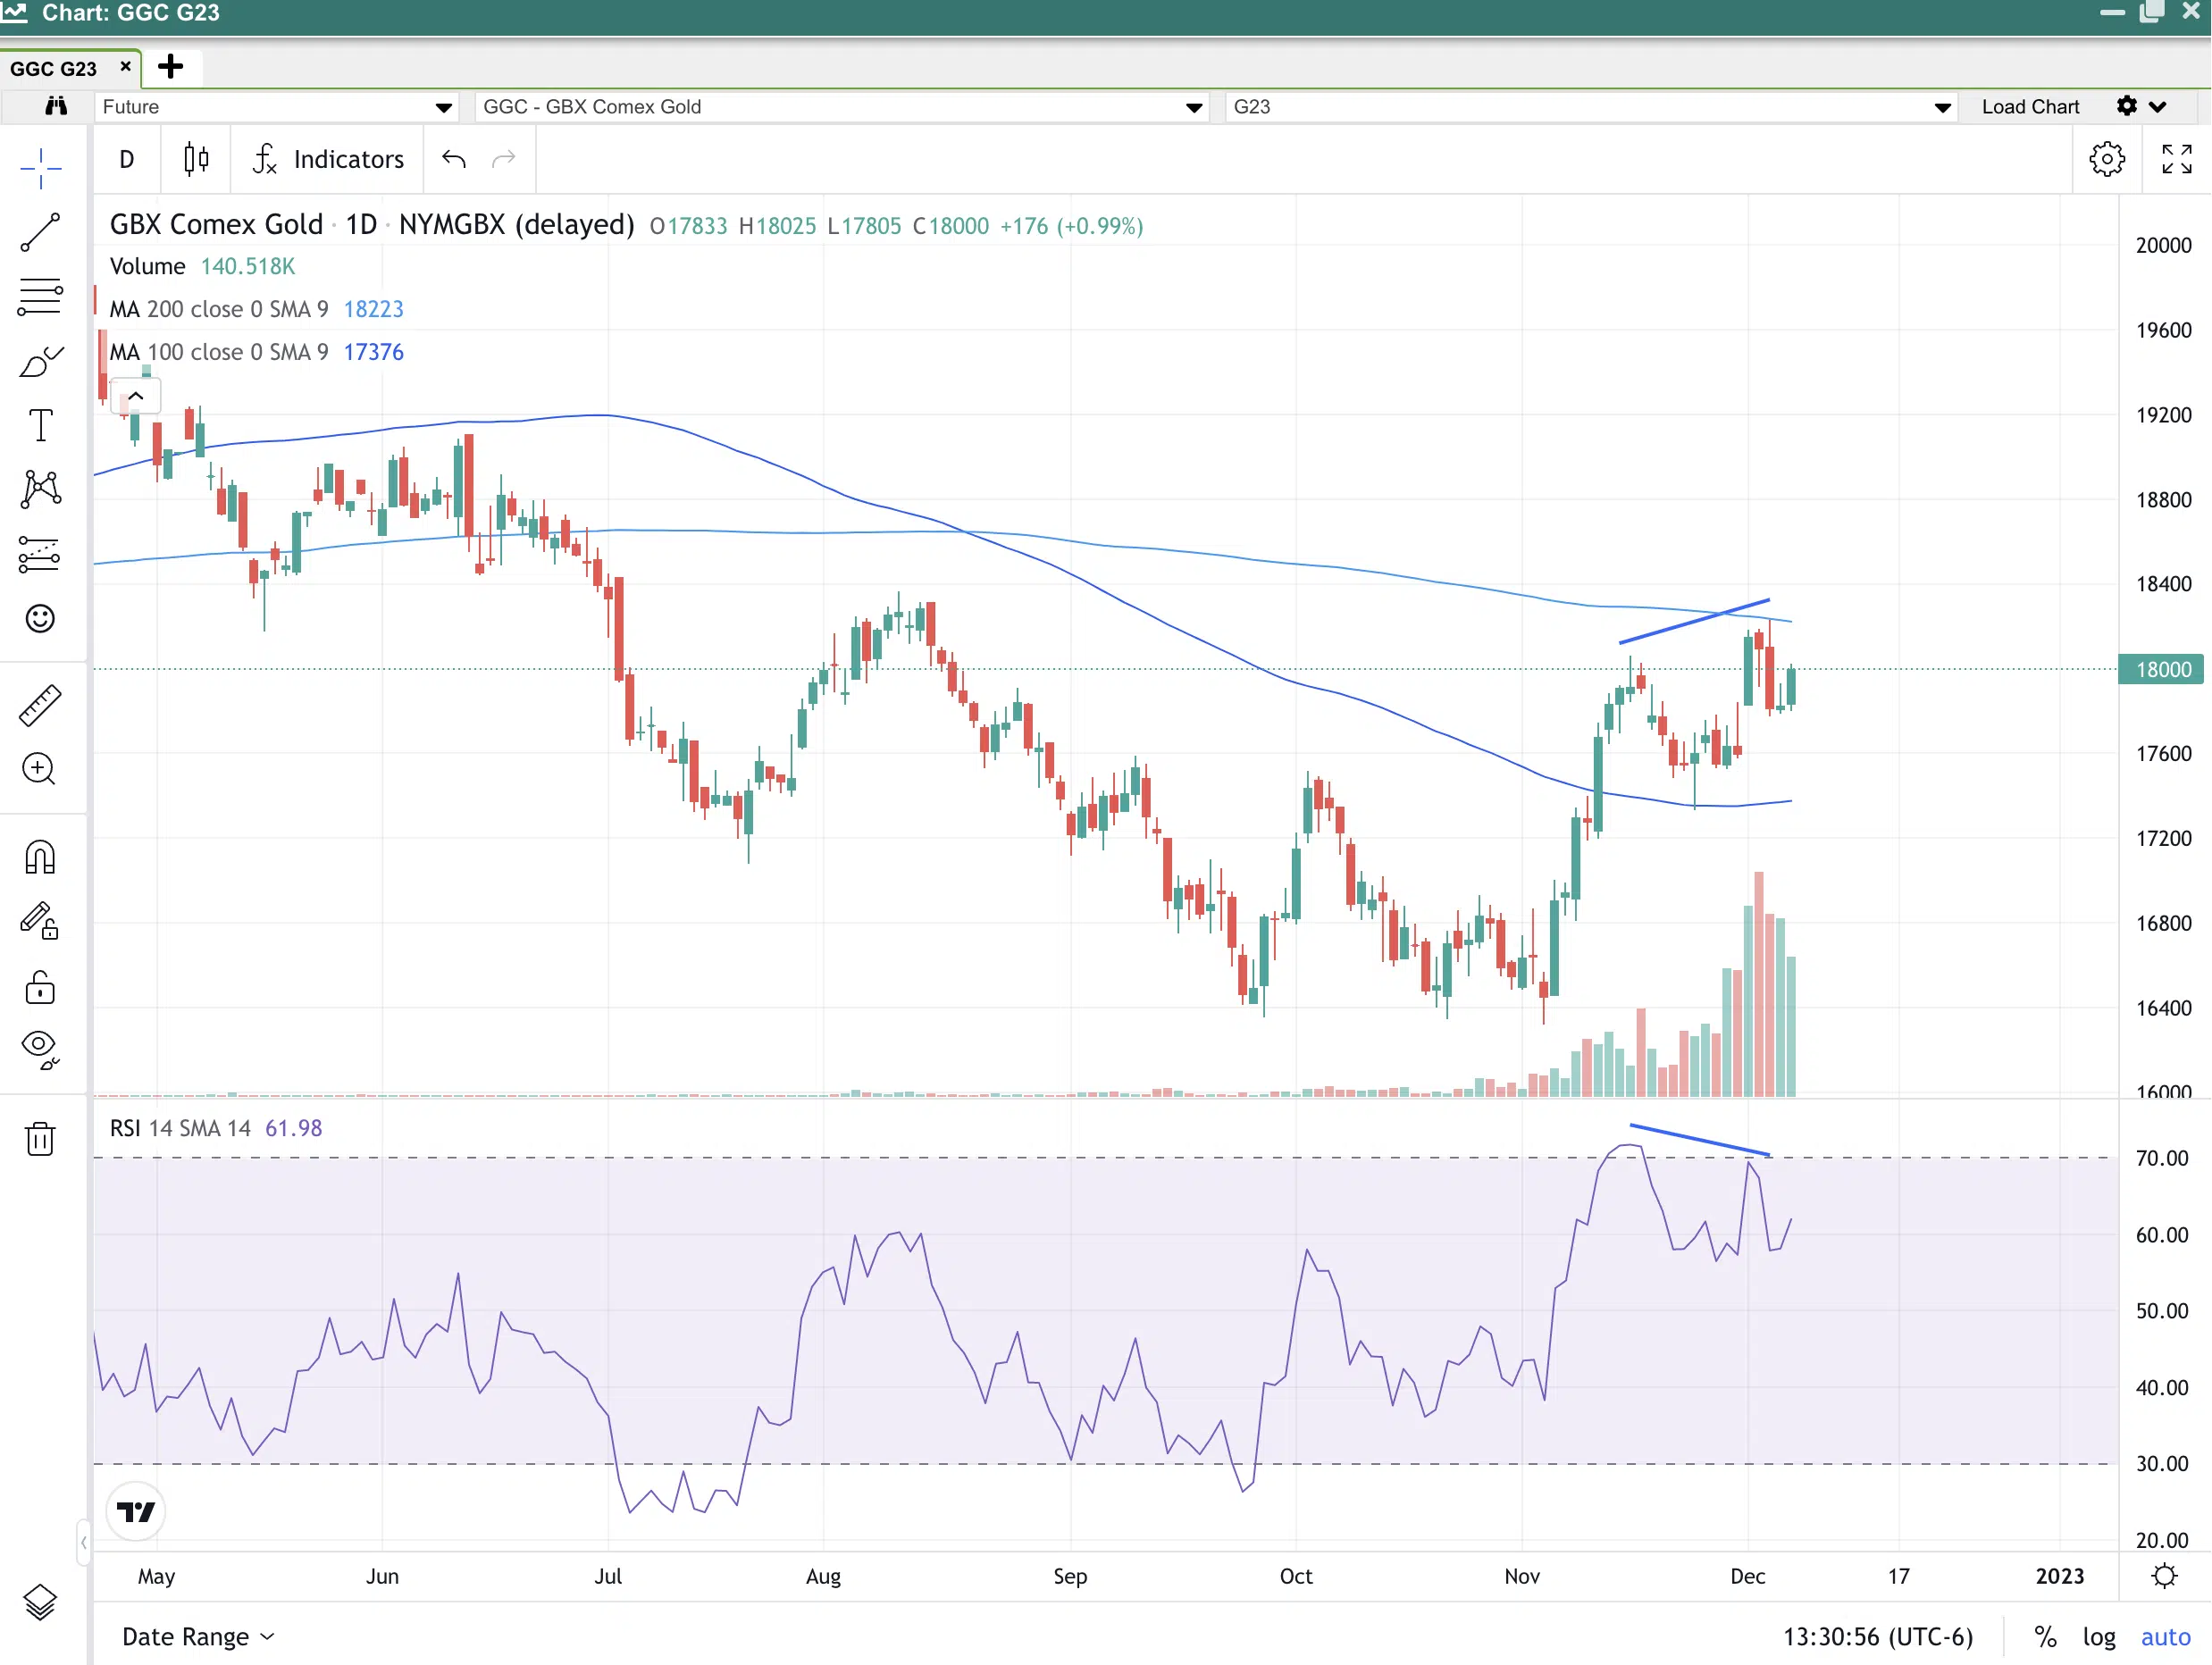
Monday’s trade had a clear bounce off the 200-day moving average and ended the day lower after making a new high. So far we have held Monday’s lows but I would not want to be caught naked if Monday’s lows are violated.
Also, note the RSI peaked on the first run higher, and as the price chart made a new high the RSI did not confirm. This signals a bearish divergence in the chart pattern.
If you have long exposure here, it would be good to use risk mitigation, either taking profits or hedging your positions with an options strategy. A breakdown back to the 100-day moving average would not be out of the possibility. It would be very important to hold the spike low at 17335.
These are a few of my thoughts, feel free to give me a call or shoot me an email if you are looking to open a futures trading account.