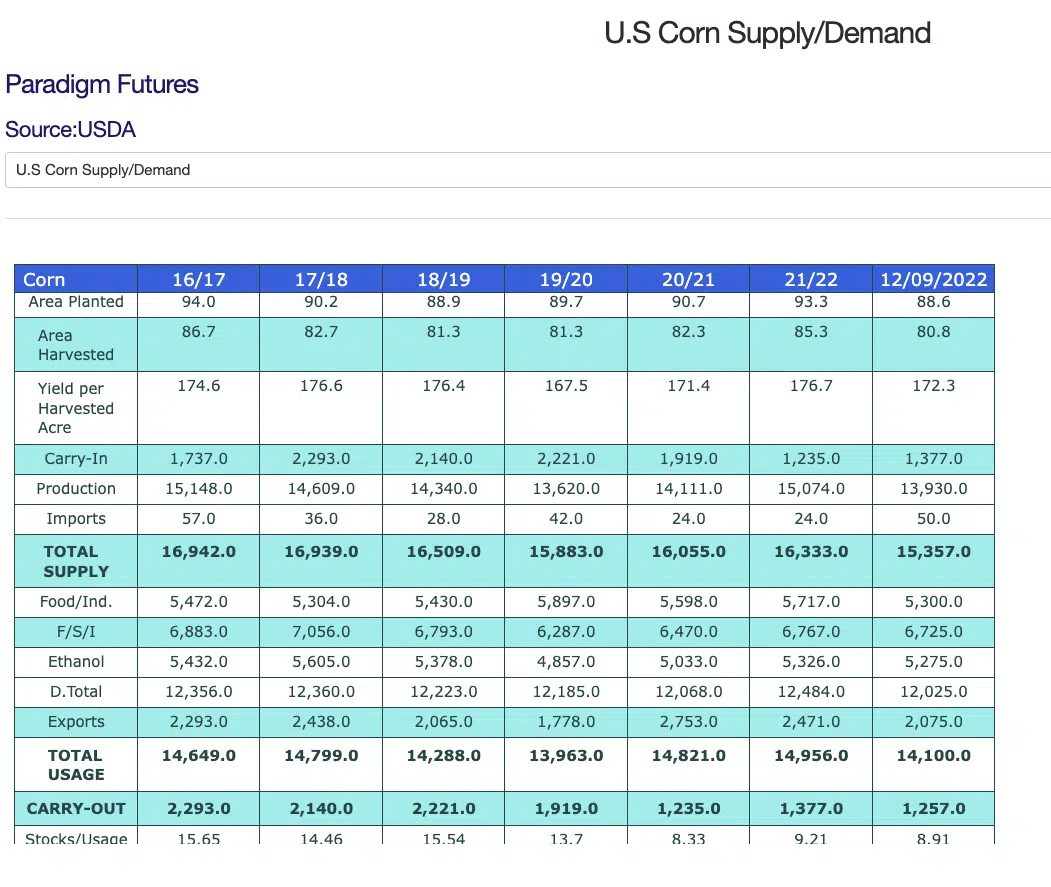
The December WASDE report showed little change for the Corn balance sheet. Coming into the report most traders and analysts expected a reduction in corn exports based on the weekly reports and the amount needed per week to reach the USDA number from November of 2.150 billion bushels. So the reduction of 75 million bushels was well anticipated.
One thing I would like to note is they did not adjust the Feed and Residual number. (I have it mislabeled as “Food/Ind.”) It appears to us that the Feed/Residual number does have some room to grow based on animal numbers.
Broiler Hatchery: Cumulative placements are up 2% from the previous year. 9.03 billion chicks placed as of December 7th from the USDA.
Cattle on Feed: Although recent reports have fewer cattle on feed compared to last year, the cumulative amount so far this year is ahead of last year. 129,315,000 head this year vs 128,490,000 head in 2021 according to the USDA
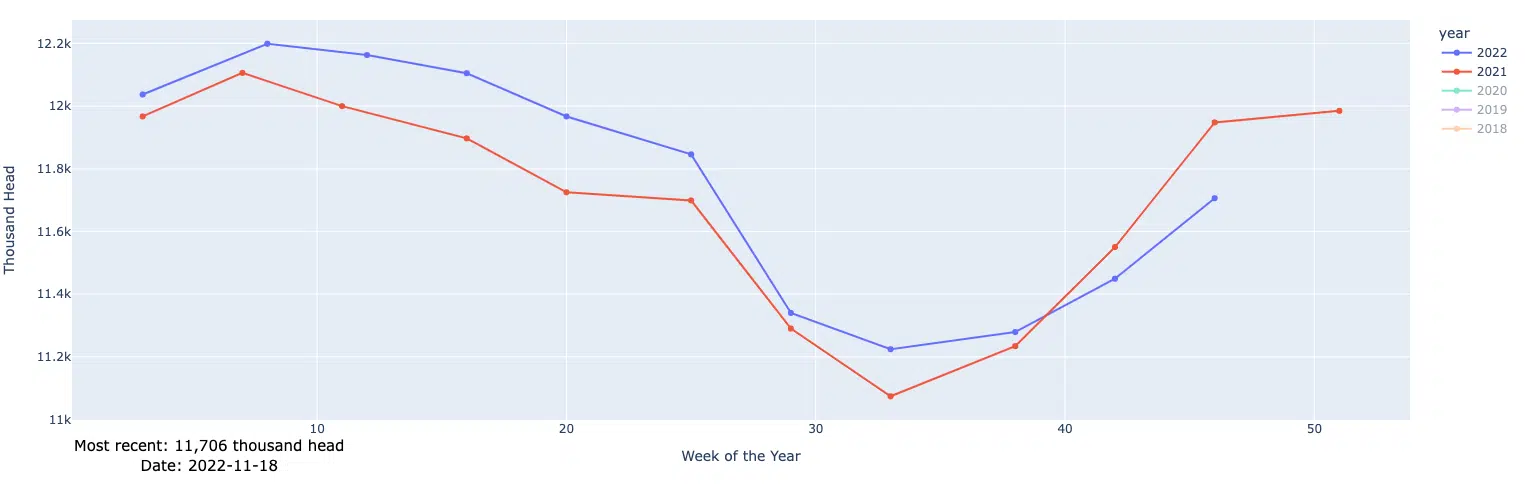
Hogs and Pigs Report: Market Hog inventory from the latest report in September was at 67.6 million head, this is down 1% from last year according to the USDA.
It’s tough to see a reduction in Feed/Industrial use by 417 million bushels, but since the Feed number is not based on hard weekly data like the export reports, it is often times a number that gets backed into to make the balance sheet work out.