Latest Price Chart on Coffee, Cotton, Cocoa, and Sugar Markets
Coffee Price Chart Update:
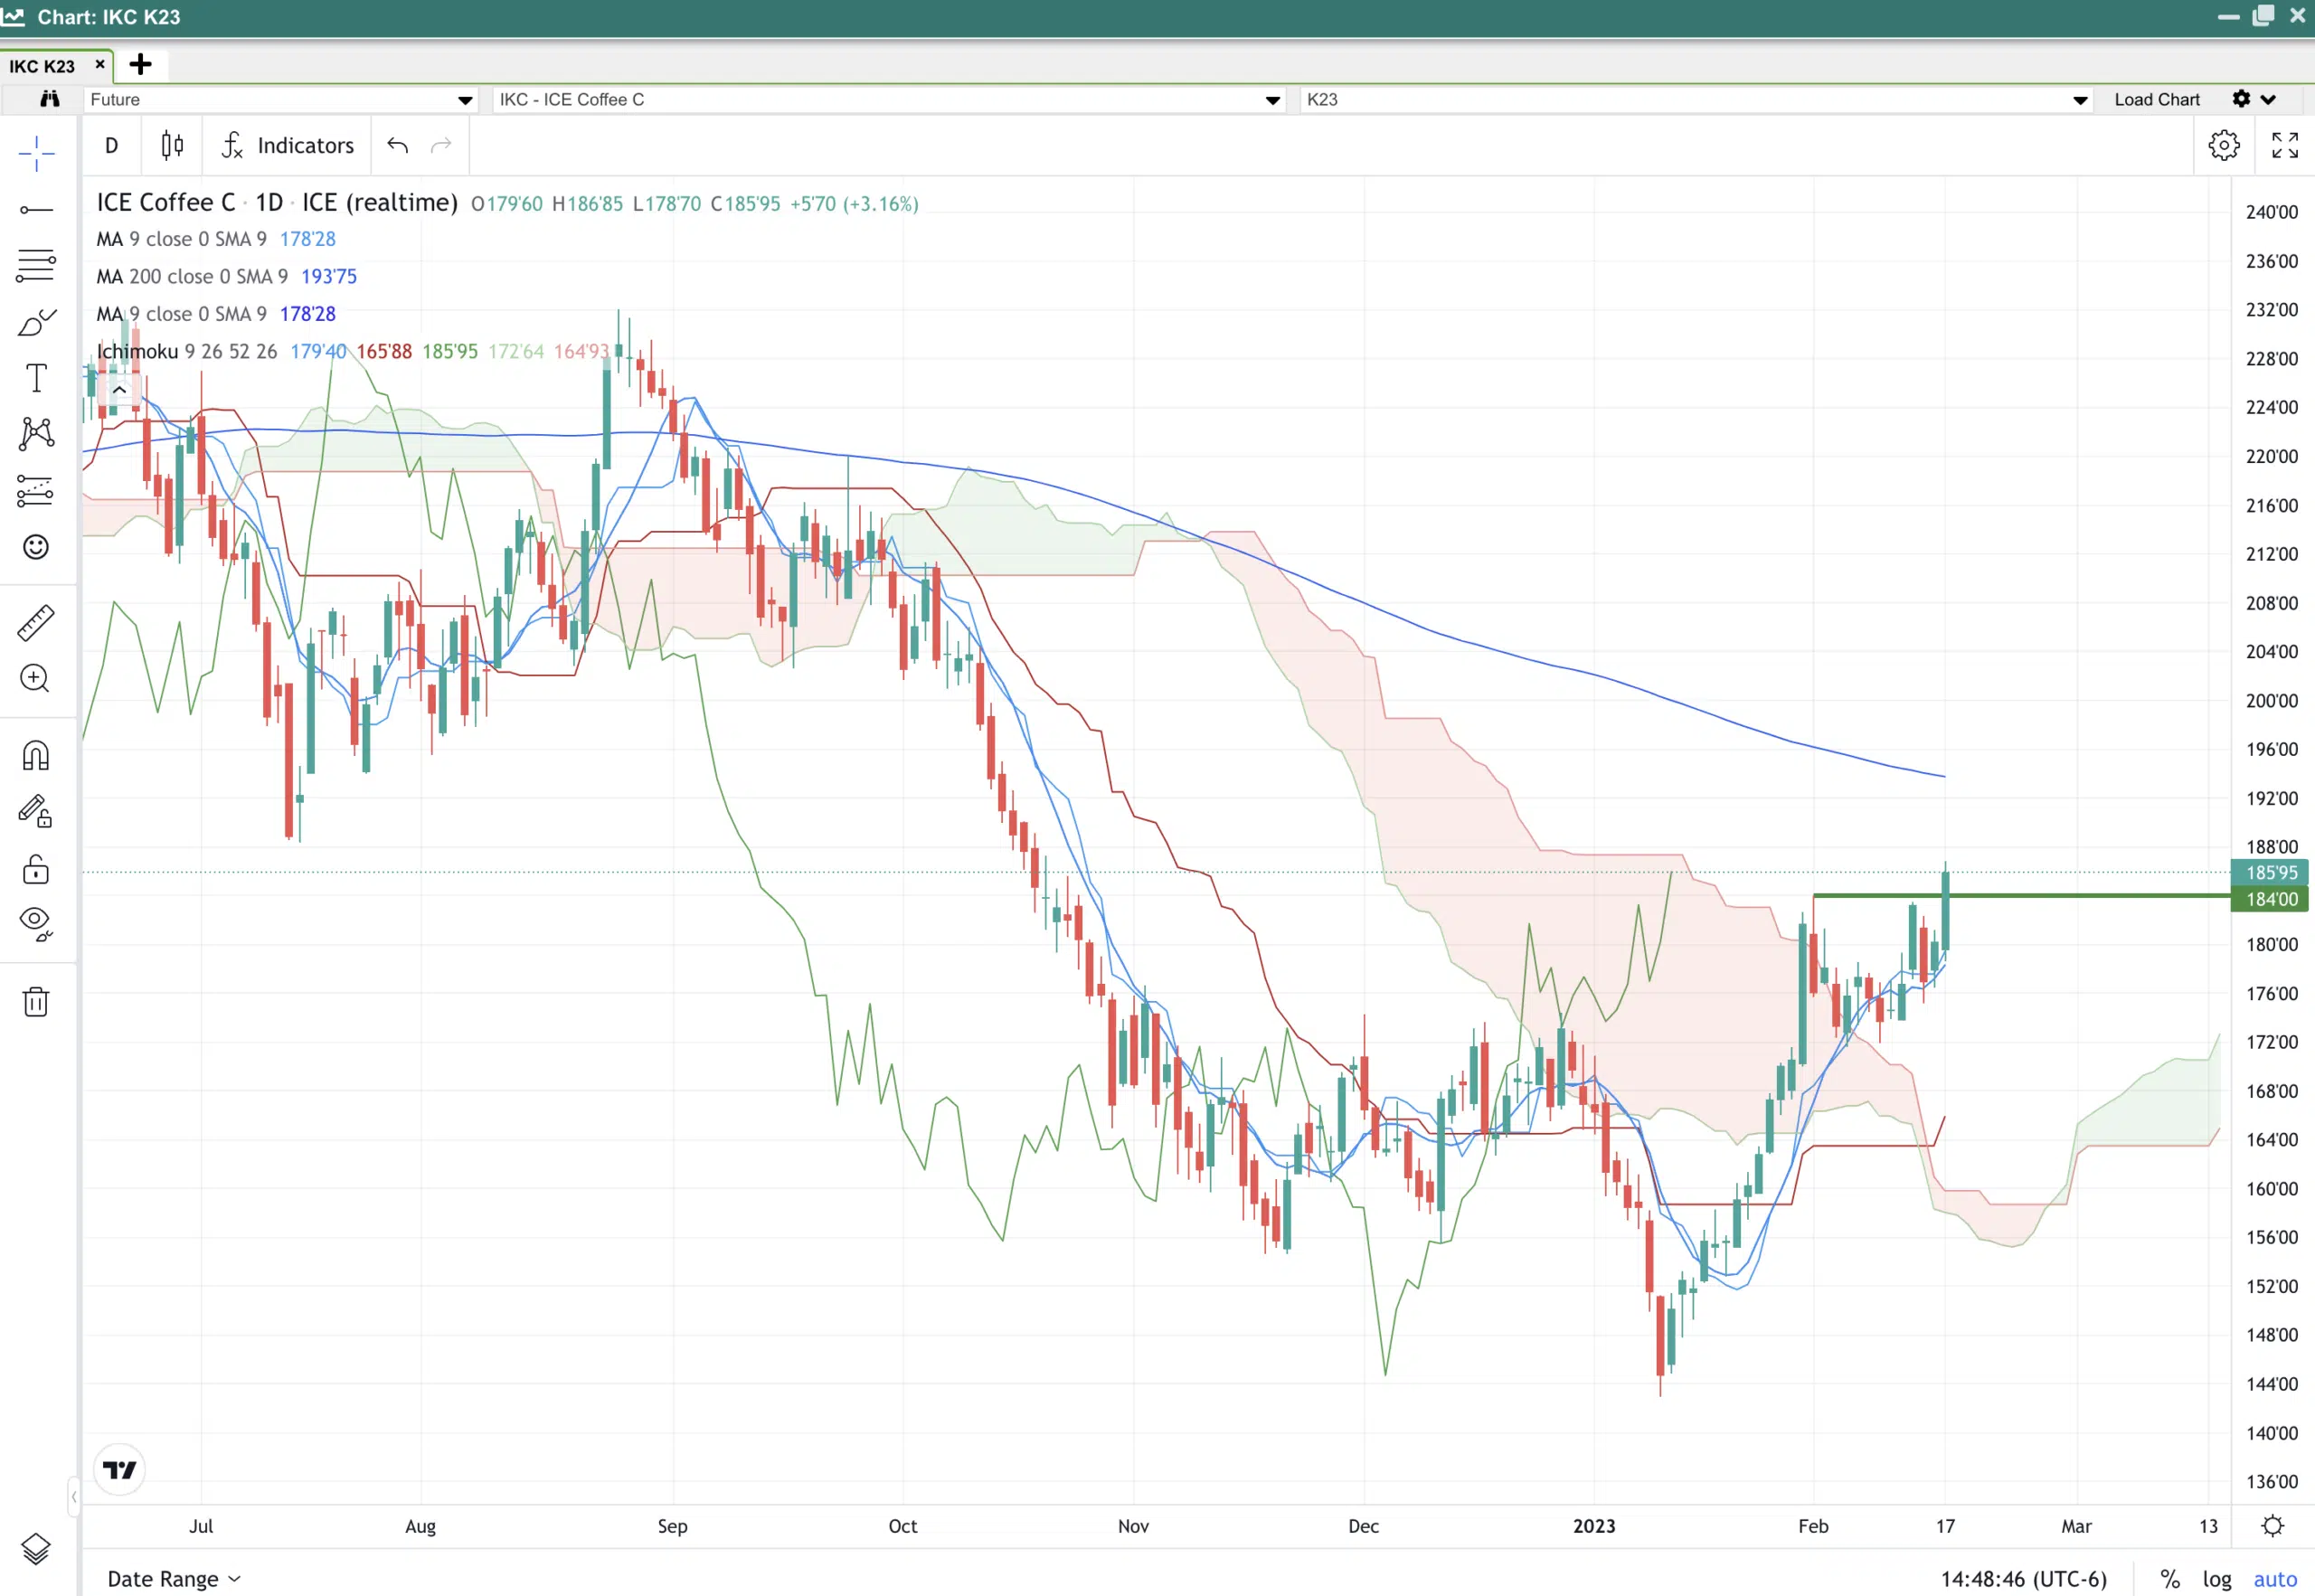
Coffee has broken out higher above consolidation. The 9-day moving average was a good support during this run-up. The next moving average of significance is the 200-day moving average. The bulls are in control of this market; without being able to see the COT reports the past three weeks has complicated trading as well. I suspect we could see a test of the 200-day moving average before taking another break.
Cocoa Price Chart Update:
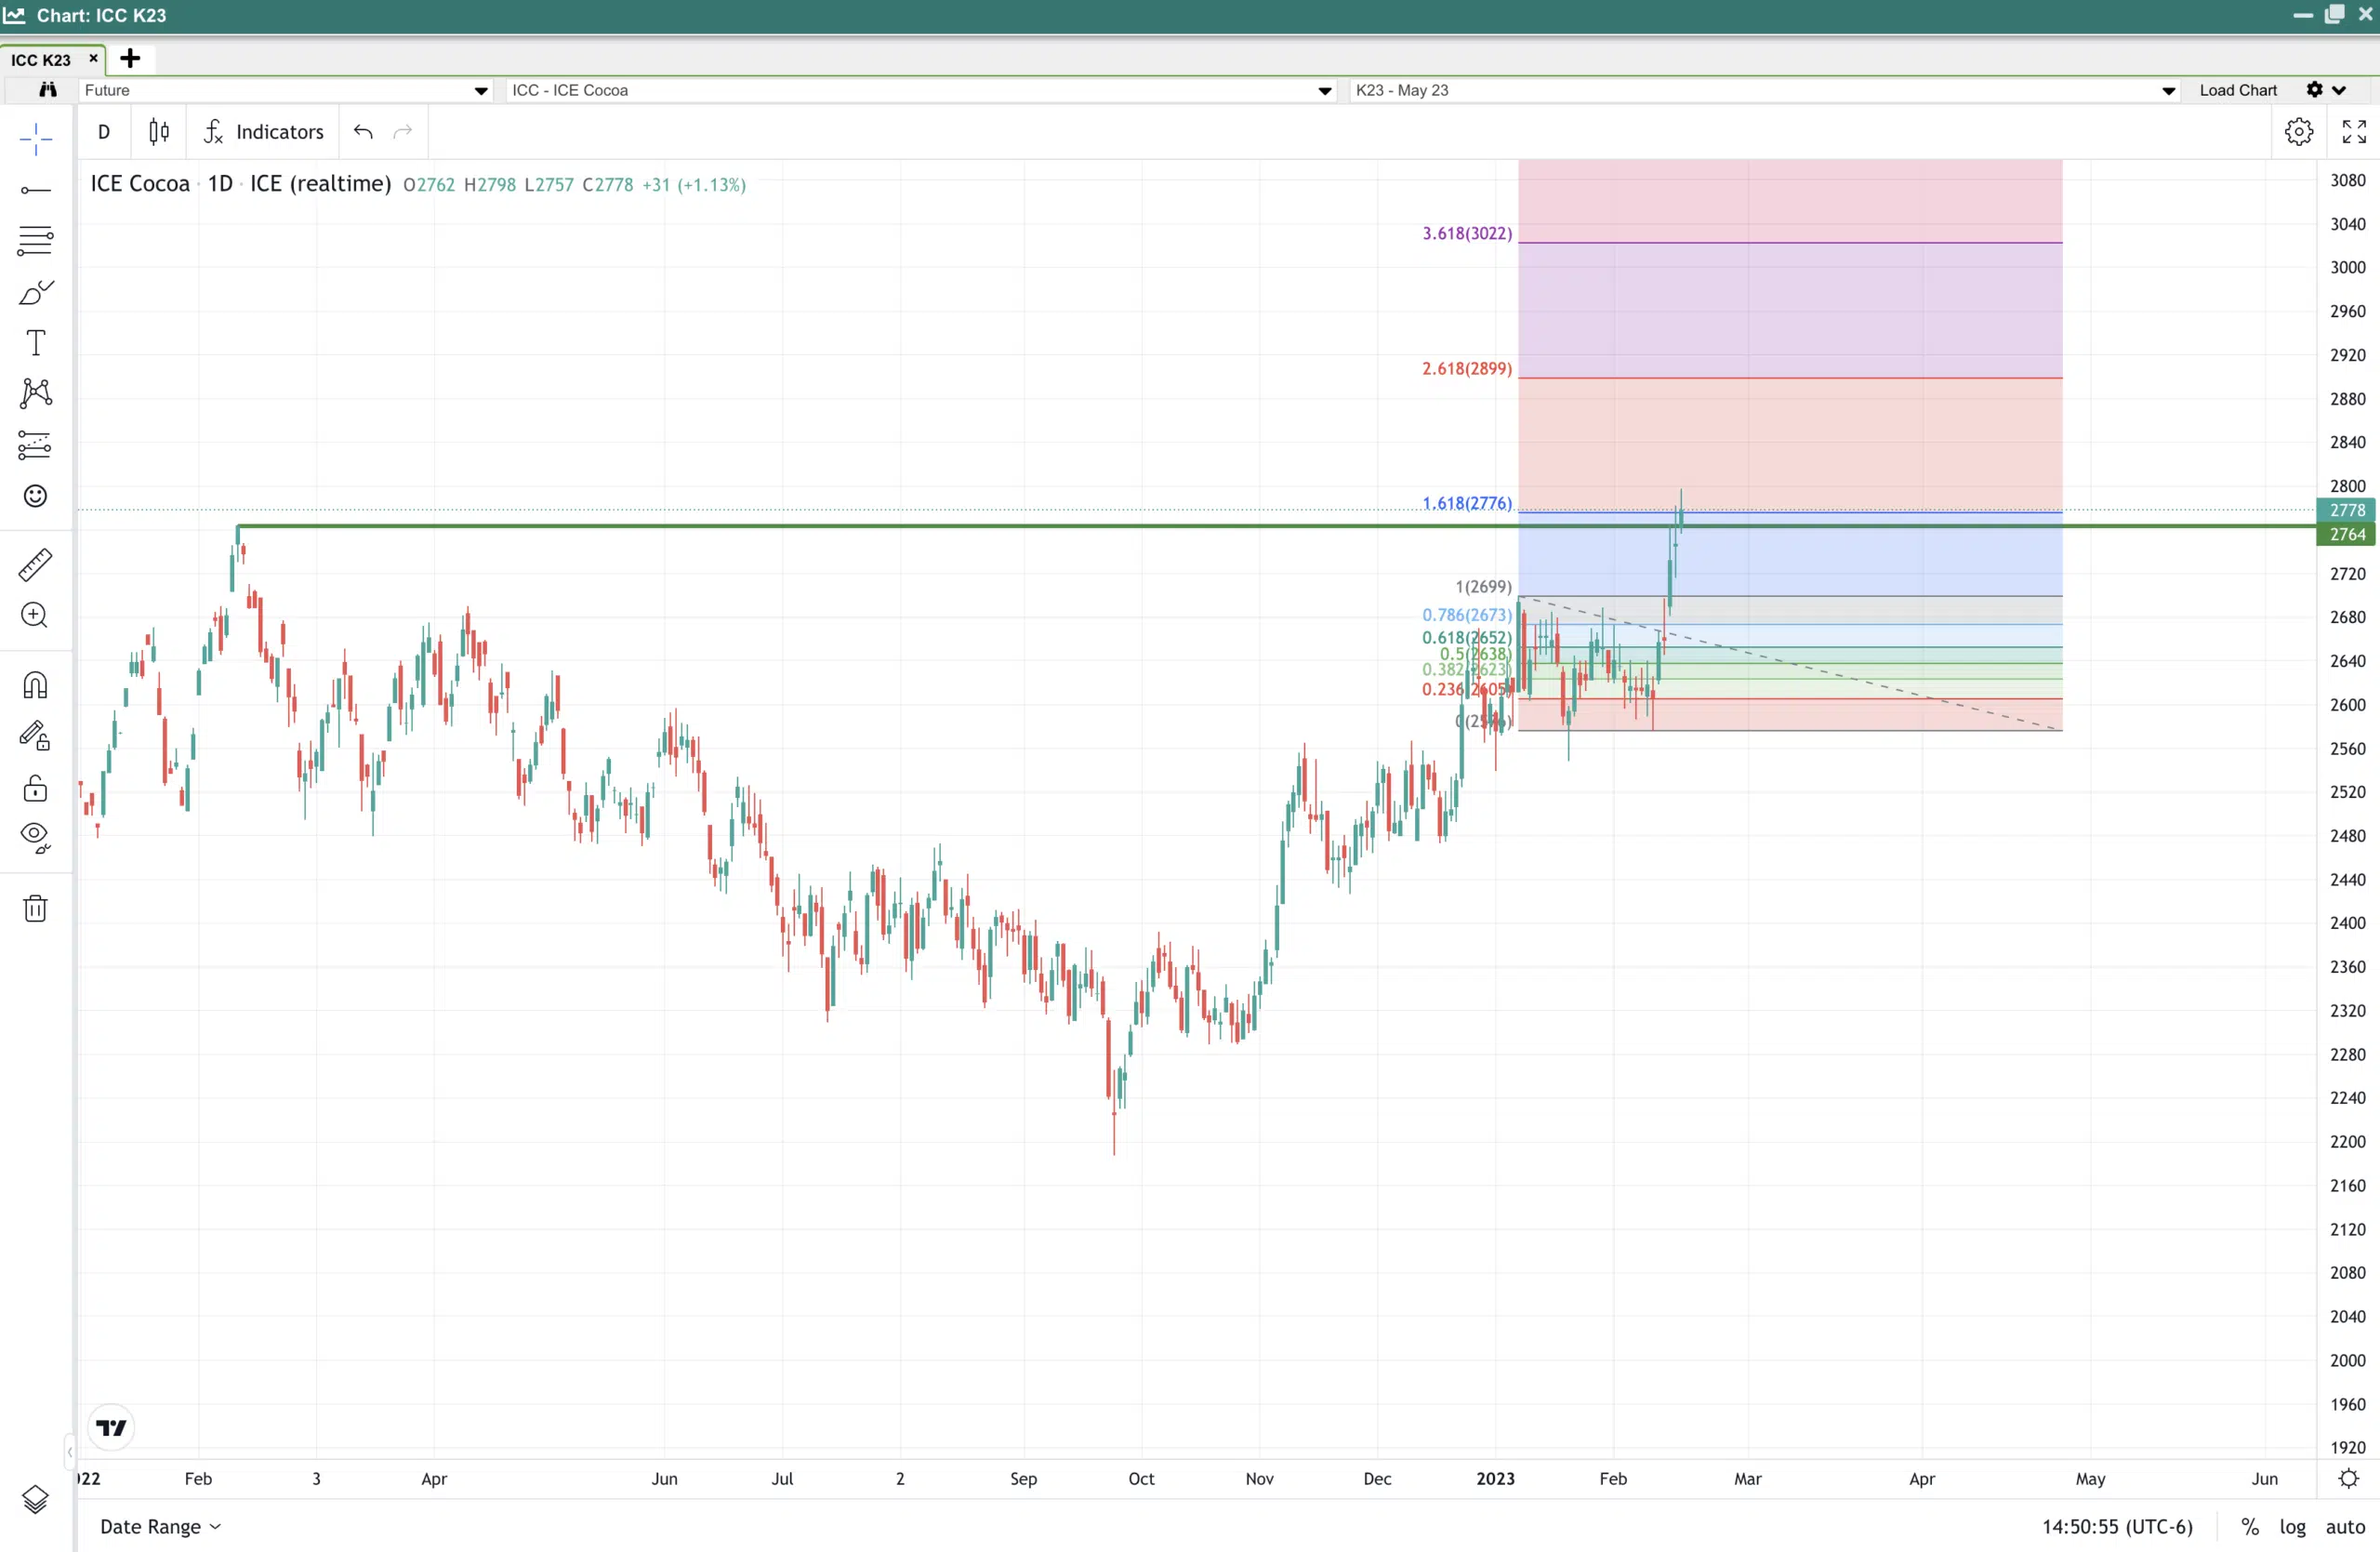
May Cocoa price took out the old high we saw at the beginning of 2022. I utilized a Fibonacci extension to illustrate of possible target. Be careful, though. Cocoa has taken old highs out before, closed above them, and then reversed course. Buying this high, we suggest pairing with an options strategy that limits risk.
Sugar Price Chart Update:
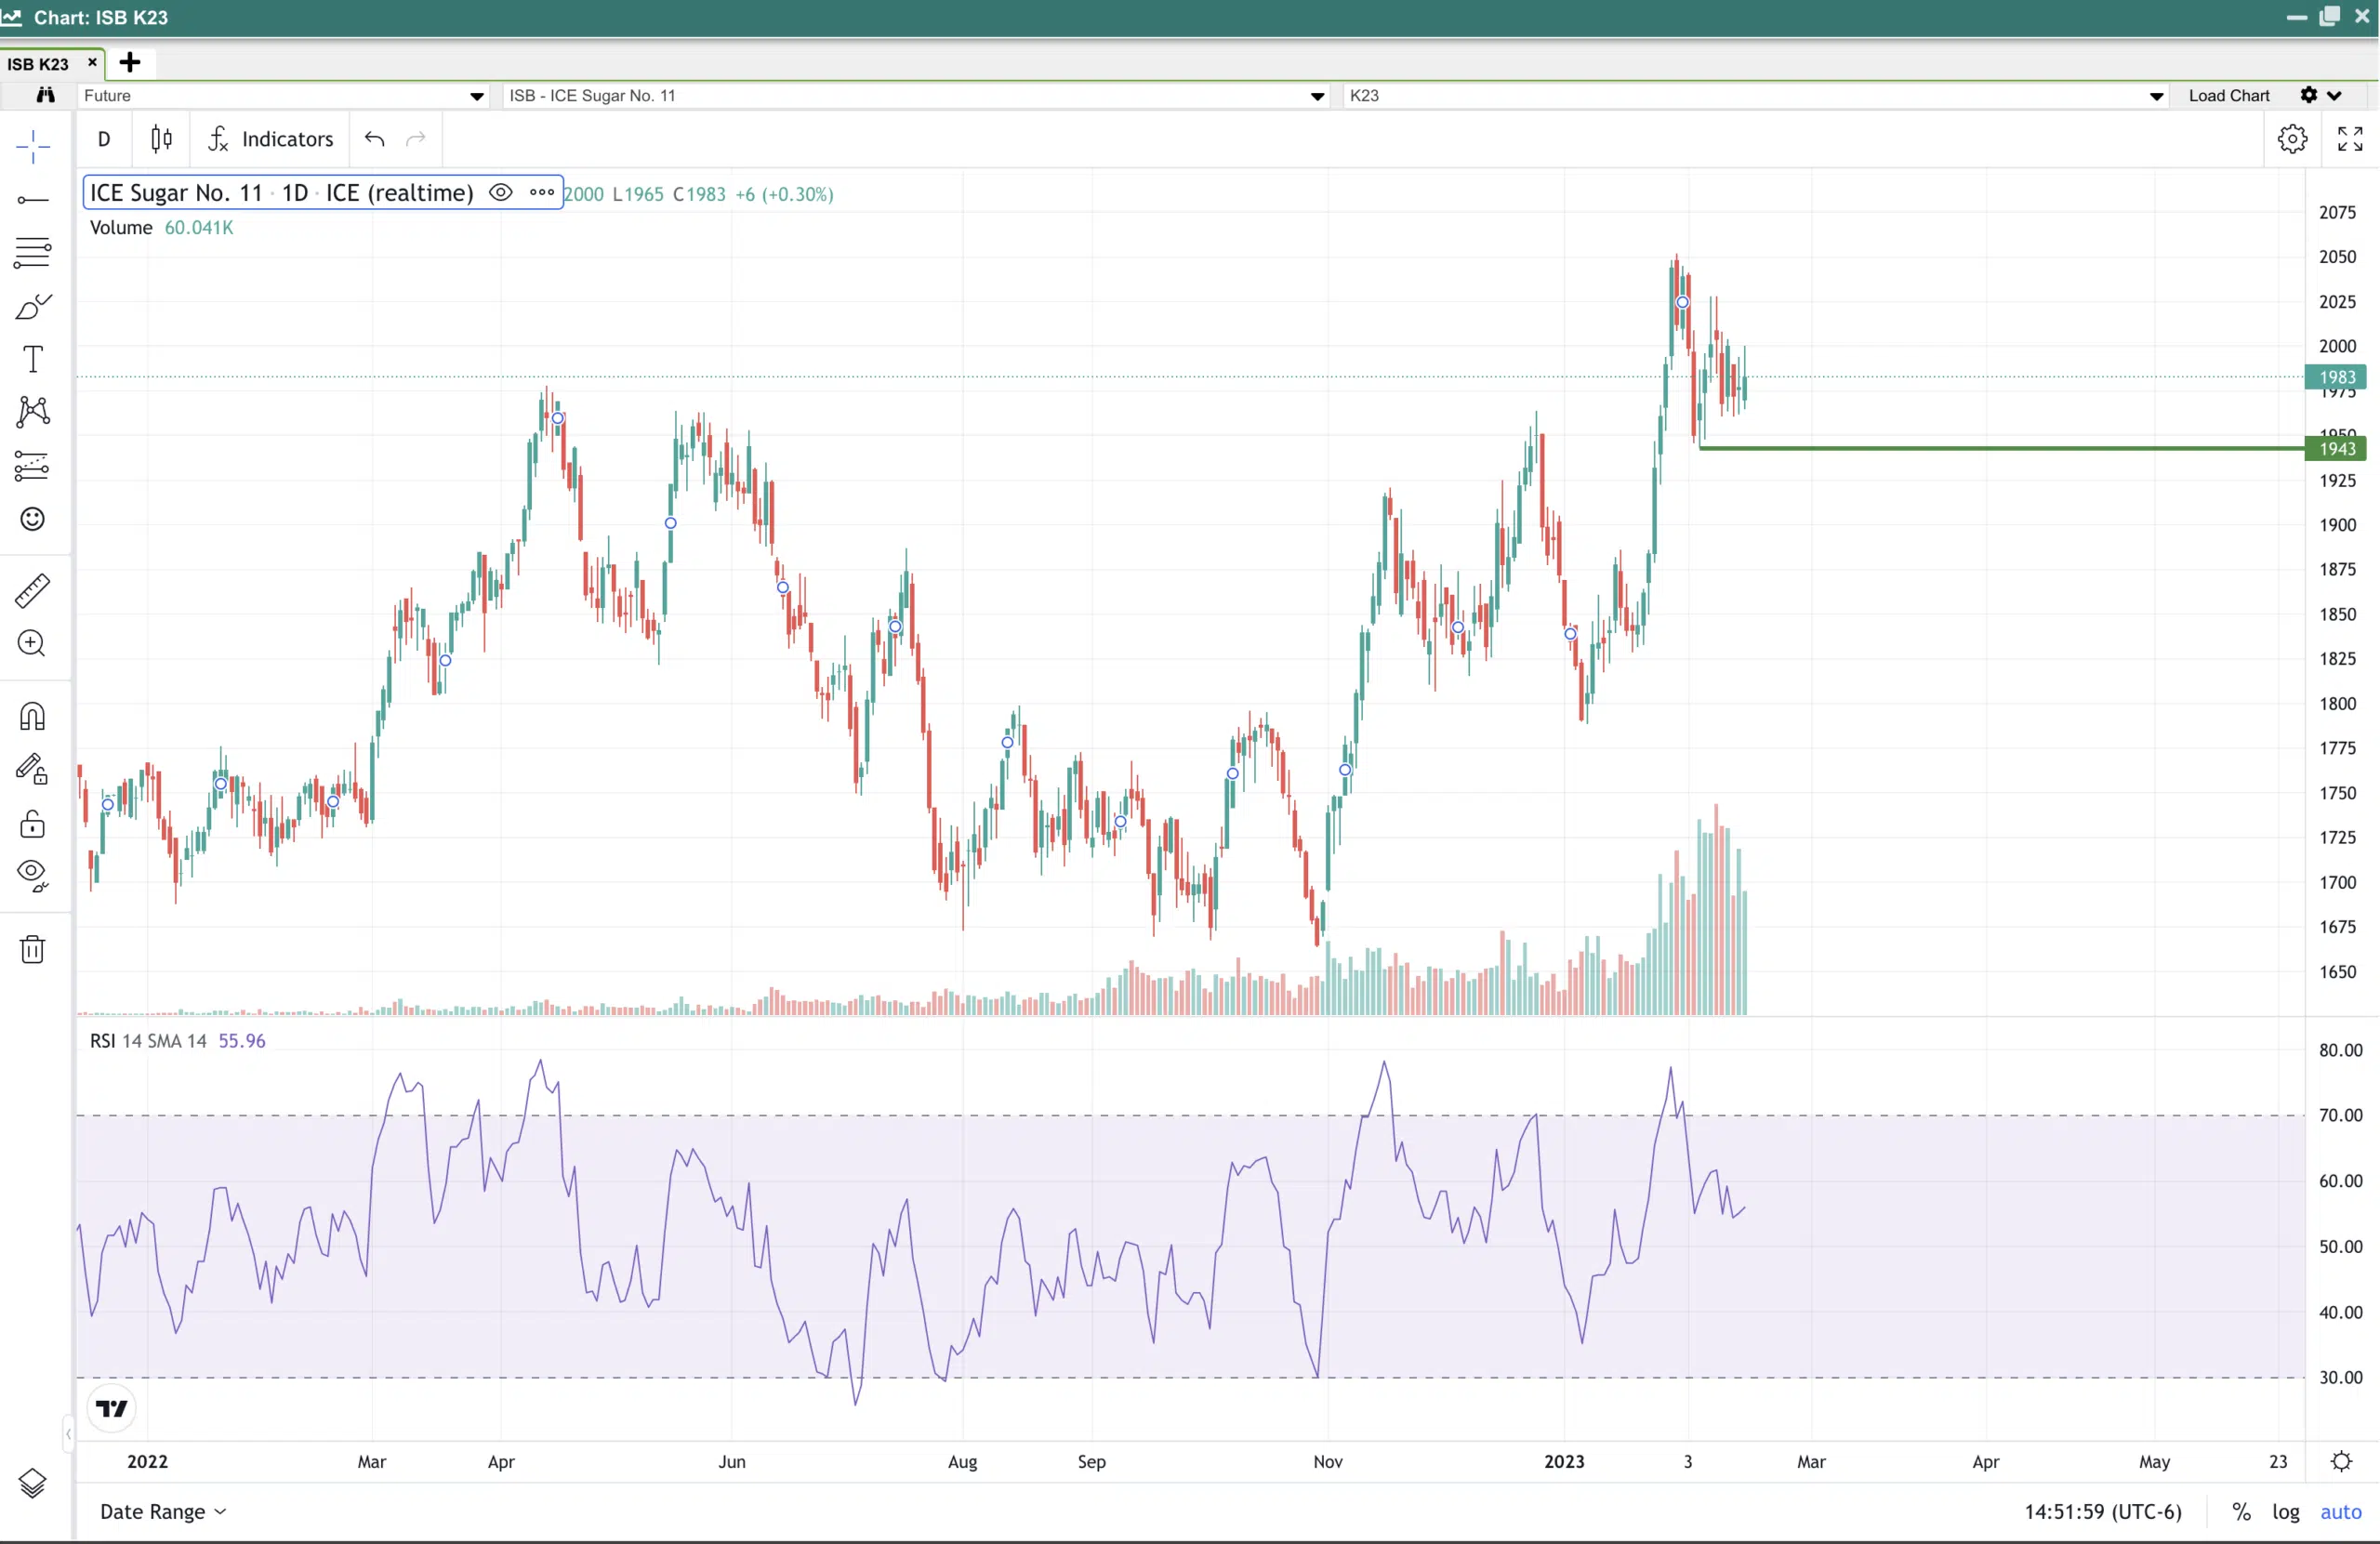
The bulls are in control of the sugar market. I outlined a possible risk level that can be used if someone wants to jump in on the long side. This level is an old low and, if broken, would confirm a breakdown of the trend. I also added the RSI to this chart.
If you get into this trade on the long side and the chart can take out the old high, you will want to watch the RSI to see if it confirms. If RSI does not confirm, then I would reinvest the profits into a put strategy to protect profits. If the market continues to run, the Puts will need to be managed and rolled up higher as the market continues to run. We all know that trees don’t grow to the sky, so it will be essential to protect profits. Please reach out to Jamie or Kent, and we can help tailor a strategy.
Cotton Price Chart Update:
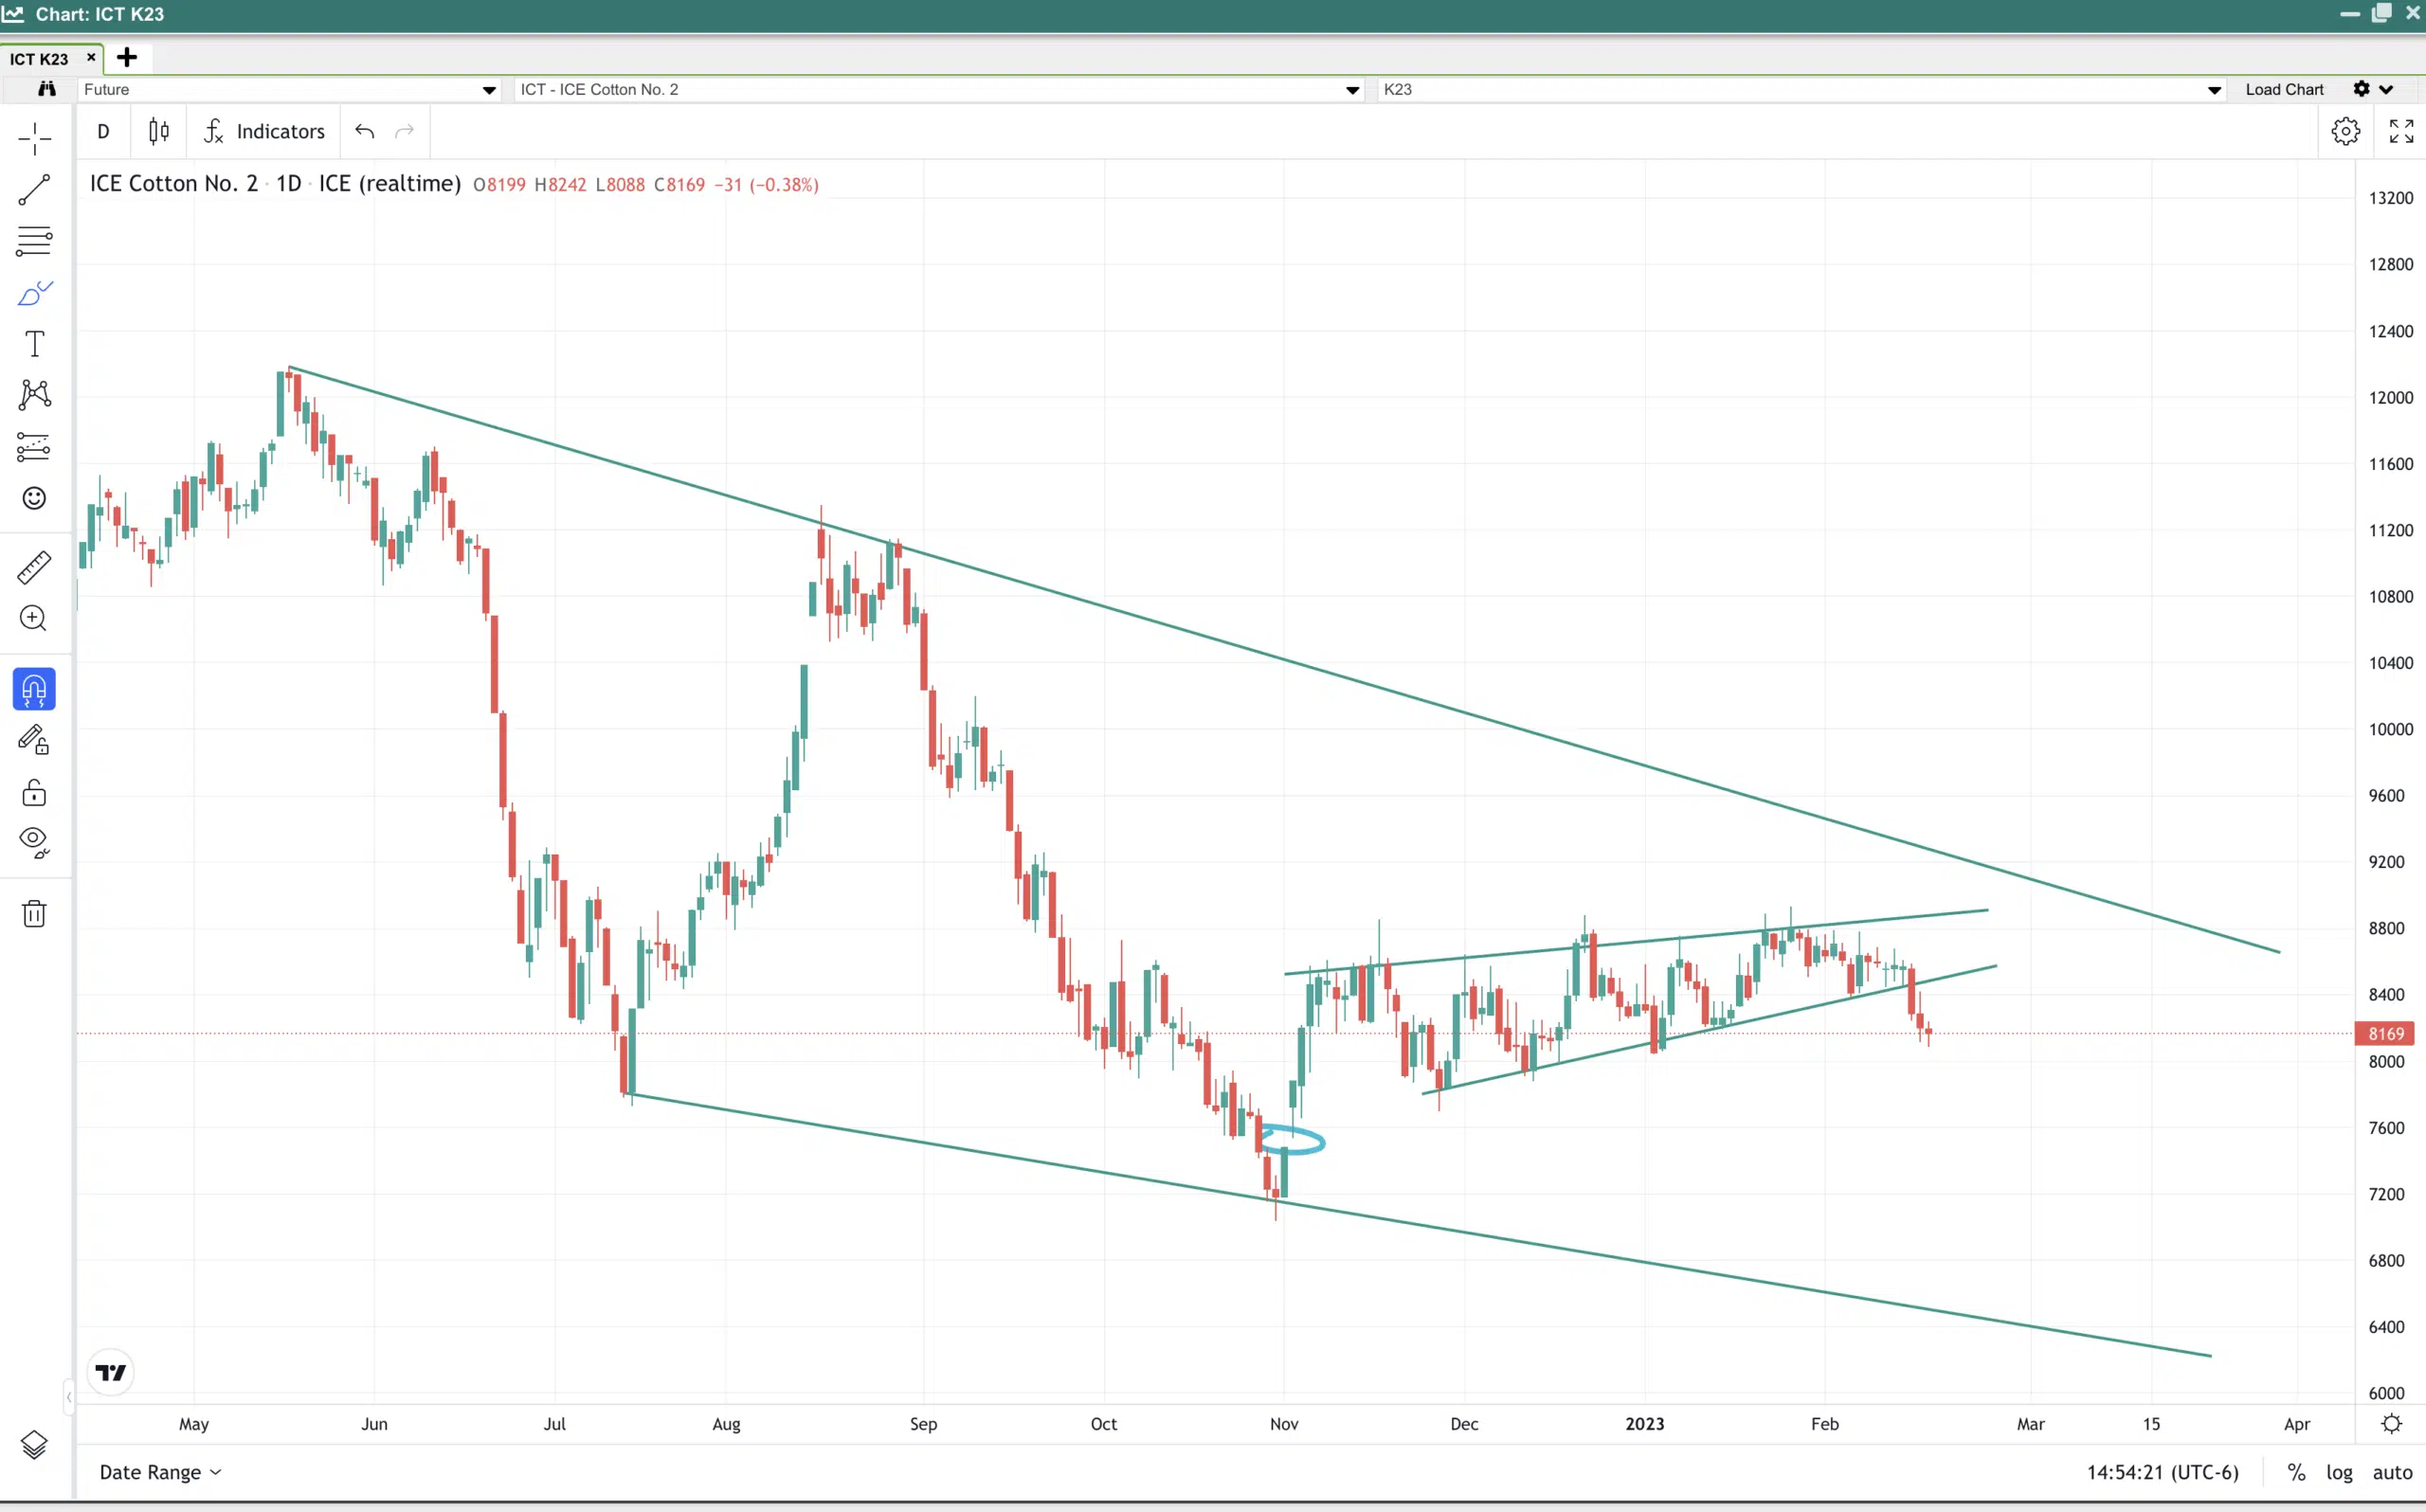
Cotton had a disappointing performance this week. It is breaking out lower of a flag formation that it’s been in for a few months. This comes at a time when the U.S. will be making plans on what crop to plant. Cotton is planted in the southern U.S. at current price levels; Cotton is not buying any acres away from Corn or Soybeans.
I pointed out the gap below the market that I think the market could be gunning for. I put in a few trend lines that stuck out to me. Lately, trend lines across all markets have been broken, and then markets retraced. Trend lines are not always all or nothing, so be mindful.
If you like what you see on the charts and want to take advantage of the current markets feel free to reach out to us or to get your account started go ahead and click the link in the top right of the page “open account” or click here.
Futures prices may have already factored in the seasonal aspects of supply and demand. Unless otherwise indicated , this is not to be an offer to sell a solicitation to buy any futures or options on futures contracts. This data is from soruces we believe to be reliable but cannot guarantee its accuracy. Opinions expressed are subject to change without notice. Trading commodity futures and options on futures involve substantial risk and may not be appropriate for everyone. Past performance may not necessarily be indicative of future results.